Jupyter notebooks, also known as Google Colab notebooks, is a modern labnotebook with data analysis capabilities built into the text. It allows you to write and execute Python in your browser with high security, zero configuration required, and easy sharing. We can use this tool for easy-to-use analysis of our UV-Vis data.
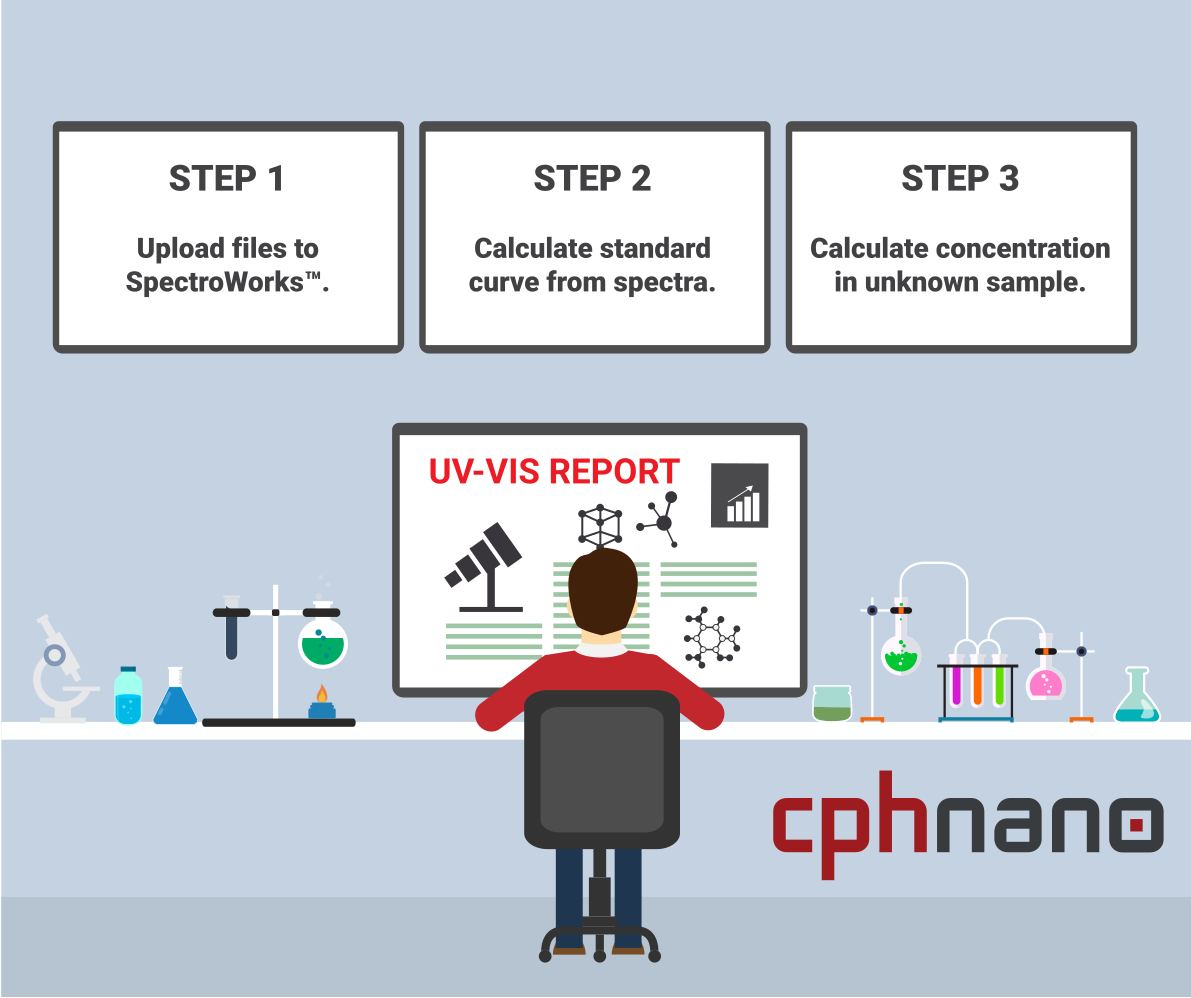 Here is the raw data uploaded made on Shimadzu UV-1800 and uploaded to the standard curve project in SpectroWorks™.
| Sample name | Analyte | Solvent | Raw spectrum file |
| 0.0% BB in H2O | Brilliant blue colorant | Water | Download |
| 0.1% BB in H2O | Brilliant blue colorant | Water | Download |
| 0.25% BB in H2O | Brilliant blue colorant | Water | Download |
| 0.5% BB in H2O | Brilliant blue colorant | Water | Download |
Here is the raw file from the unknown sample project:
| Sample name | Analyte | Solvent | Raw spectrum file |
| BB in H2O | Brilliant blue colorant | Water | Download |
SpectroWorks™ for UV-Vis spectra and SpectroCuvette™ analysis comes with API access. Whether you’re a student, a scientist or a technician, Colab notebooks and SpectroWorks™ can make your work around UV-Vis spectrophotometers easier and faster.