Challenge: In, for example, the wine industry, it is sometimes required to calculate the sum of absorbance values.
Solution: The following Jupyter notebook extracts absorbance values at some wavelength and adds them together to calculate a total absorption value.
Introduction
In the wine industry, it is sometimes required to calculate the sum of 3 absorbance values, for example at 420 nm, 520, and 620 nm:
Unfortunately, SpectroWorks™ does not support calculating the sum of three absorbance values directly. However, this can be achieved by uploading the data to SpectroWorks™ and then use a Colab notebook to do the sum and generate a quality control report.
Google Colaboratory notebooks, or ‘Colab notebooks’ for short, is a modern labnotebook with data analysis capabilities built into the text. It allows you to write and execute Python in your browser with high security, zero configuration required, and easy sharing.
In the report template for quality control you have the code for extracting and adding three absorbance values via SpectroWorks™.
SpectroWorks™ for analysis comes with API access. Whether you’re a student, a scientist or a technician, Colab notebooks and SpectroWorks™ can make your work around UV-Vis spectrophotometers easier and faster.
Spectra for this SpectroWorks™ demo and the Colab report template
Below you can find a table with a link to the raw data used for this demo and uploaded to SpectroWorks™.
| DATE | CUVETTE | INSTRUMENT | FILE FORMAT | SAMPLE | DOWNLOAD |
| 2018-12-11 | Plastic PMMA | UV-Vis spectrophotometer | Text file (.txt) | Brilliant Blue 0,5% | Spectrum 01 |
| 2019-01-17 | Plastic PMMA | UV-Vis spectrophotometer | Text file (.txt) | Brilliant Blue 0,5% | Spectrum 02 |
Steps in SpectroWorks™
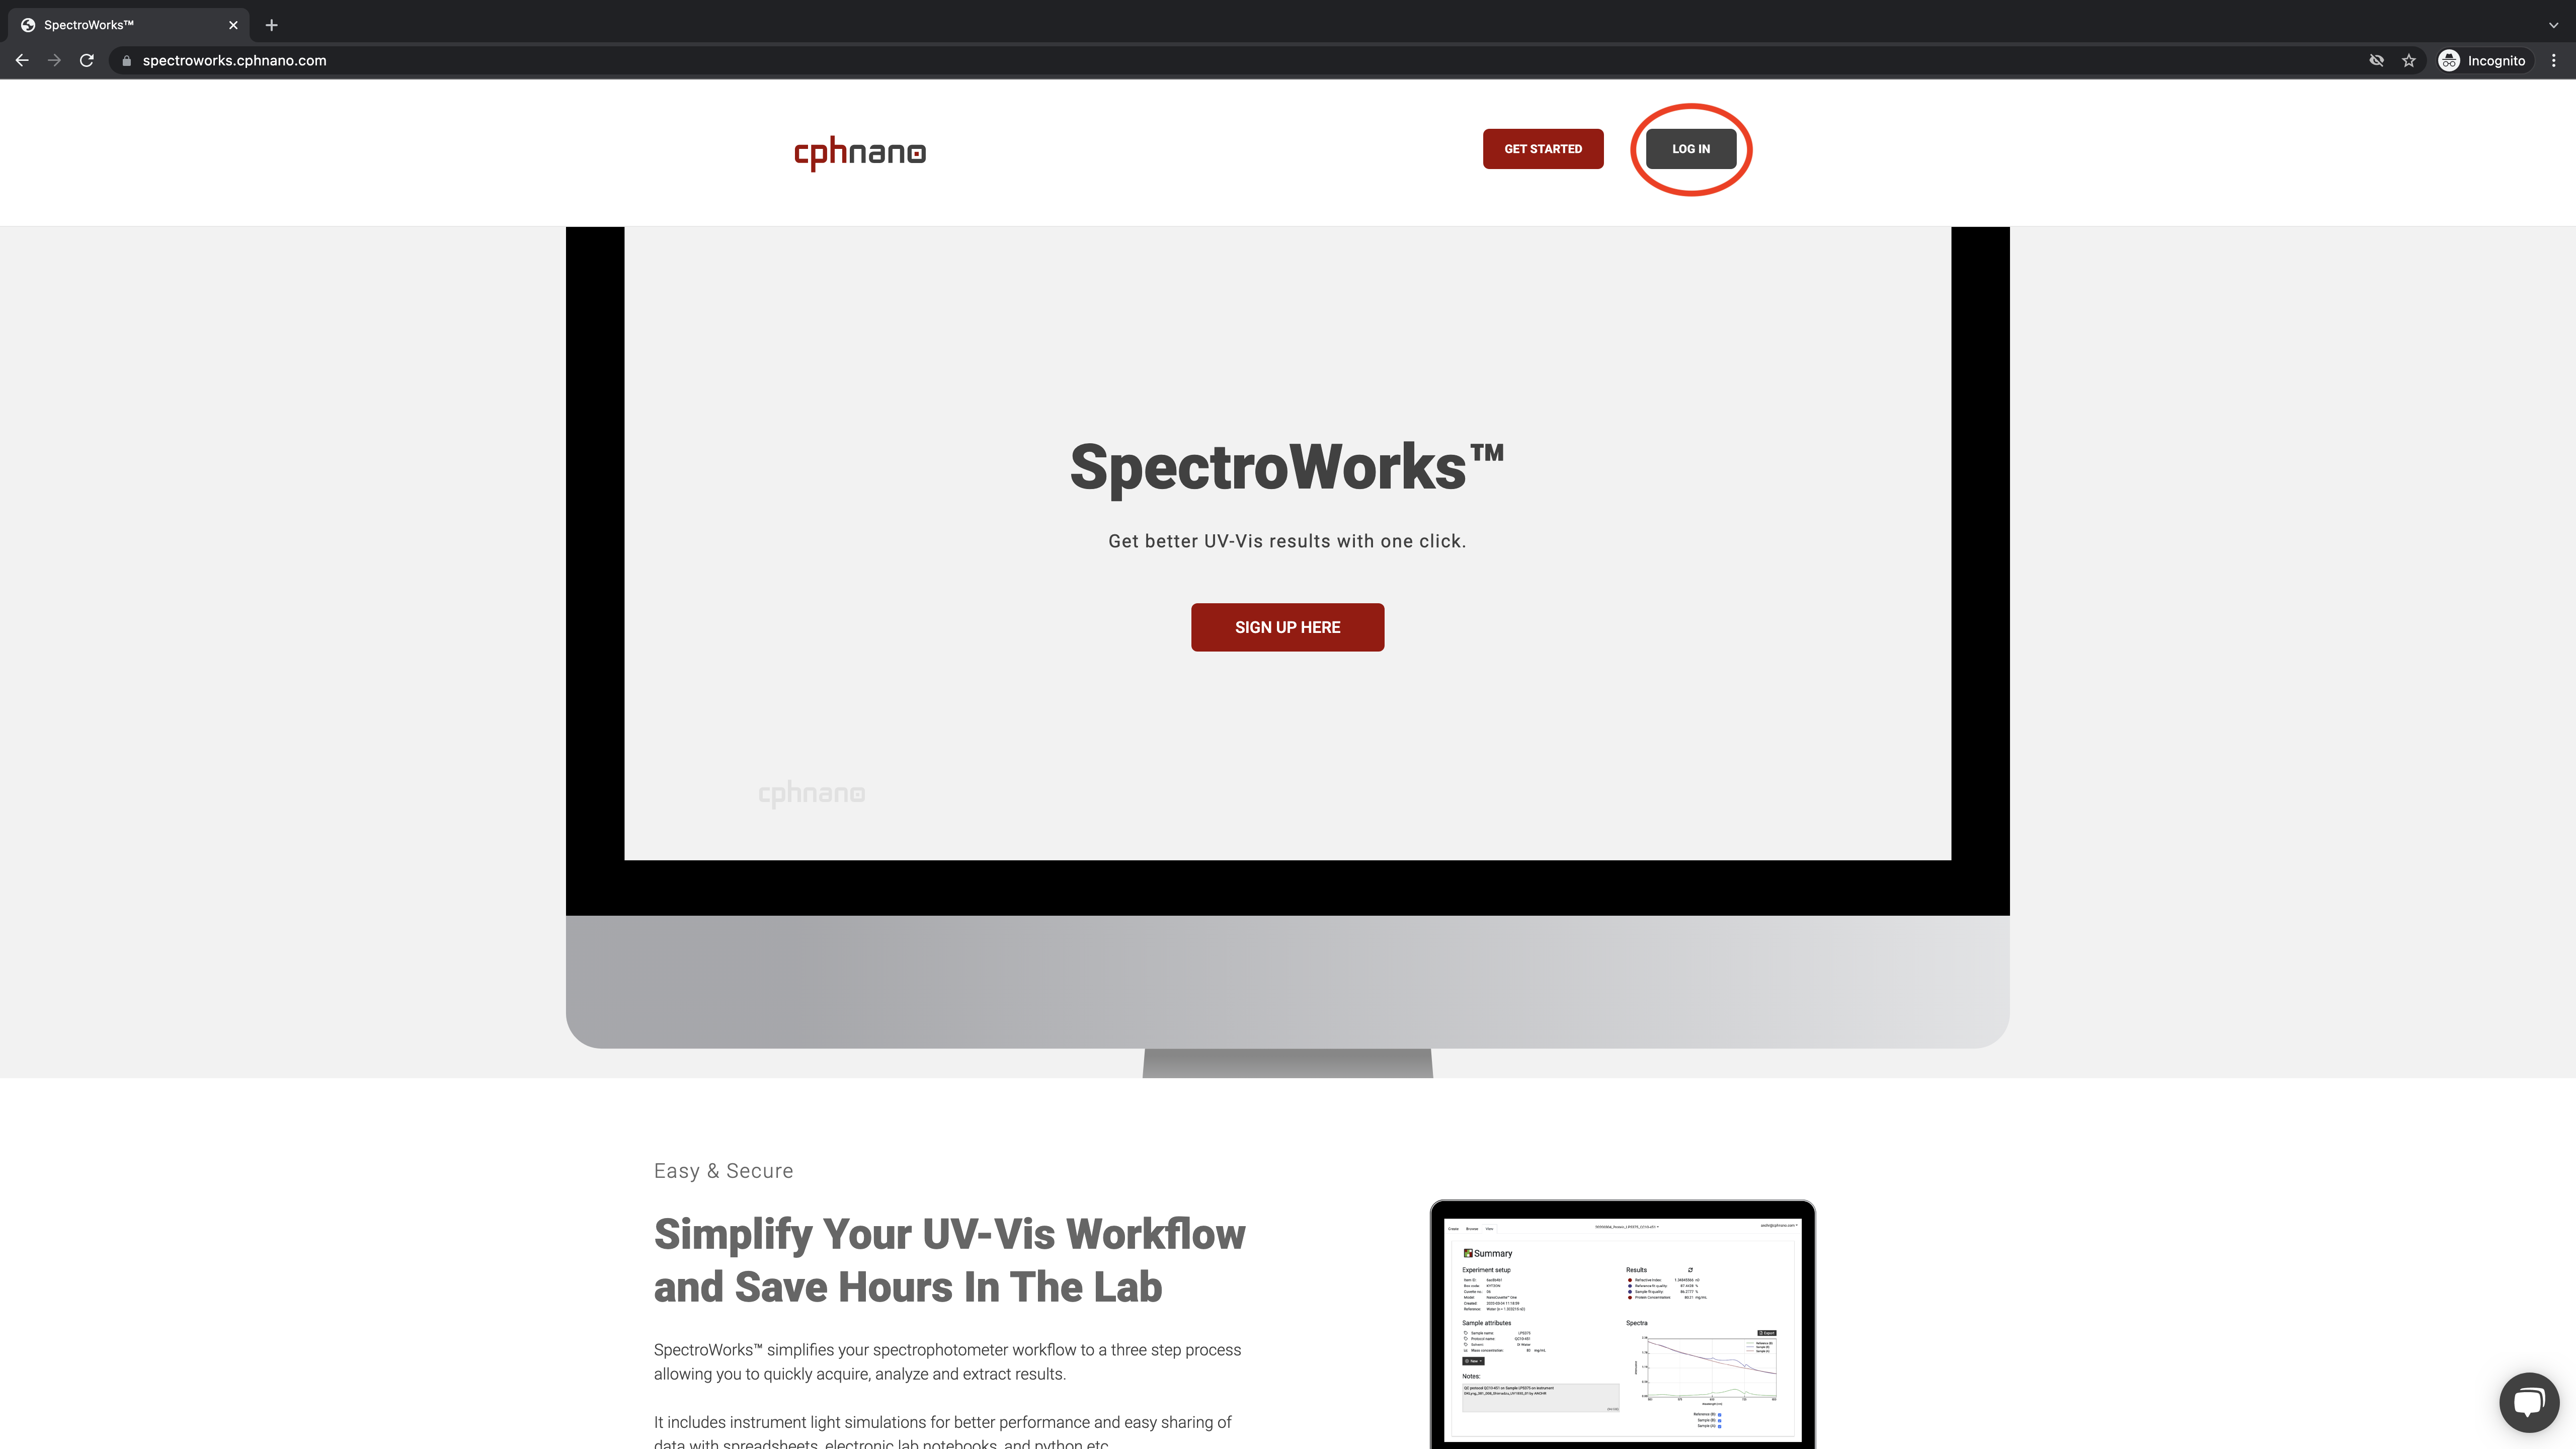
Step 01: Log in
Start by logging into SpectroWorks™ at https://spectroworks.com/ by clicking on LOG IN in top right window. If you do not already have a profile, create a new profile by clicking SIGN UP in the bottom of the login screen.
Step 02: Create a project in SpectroWorks™
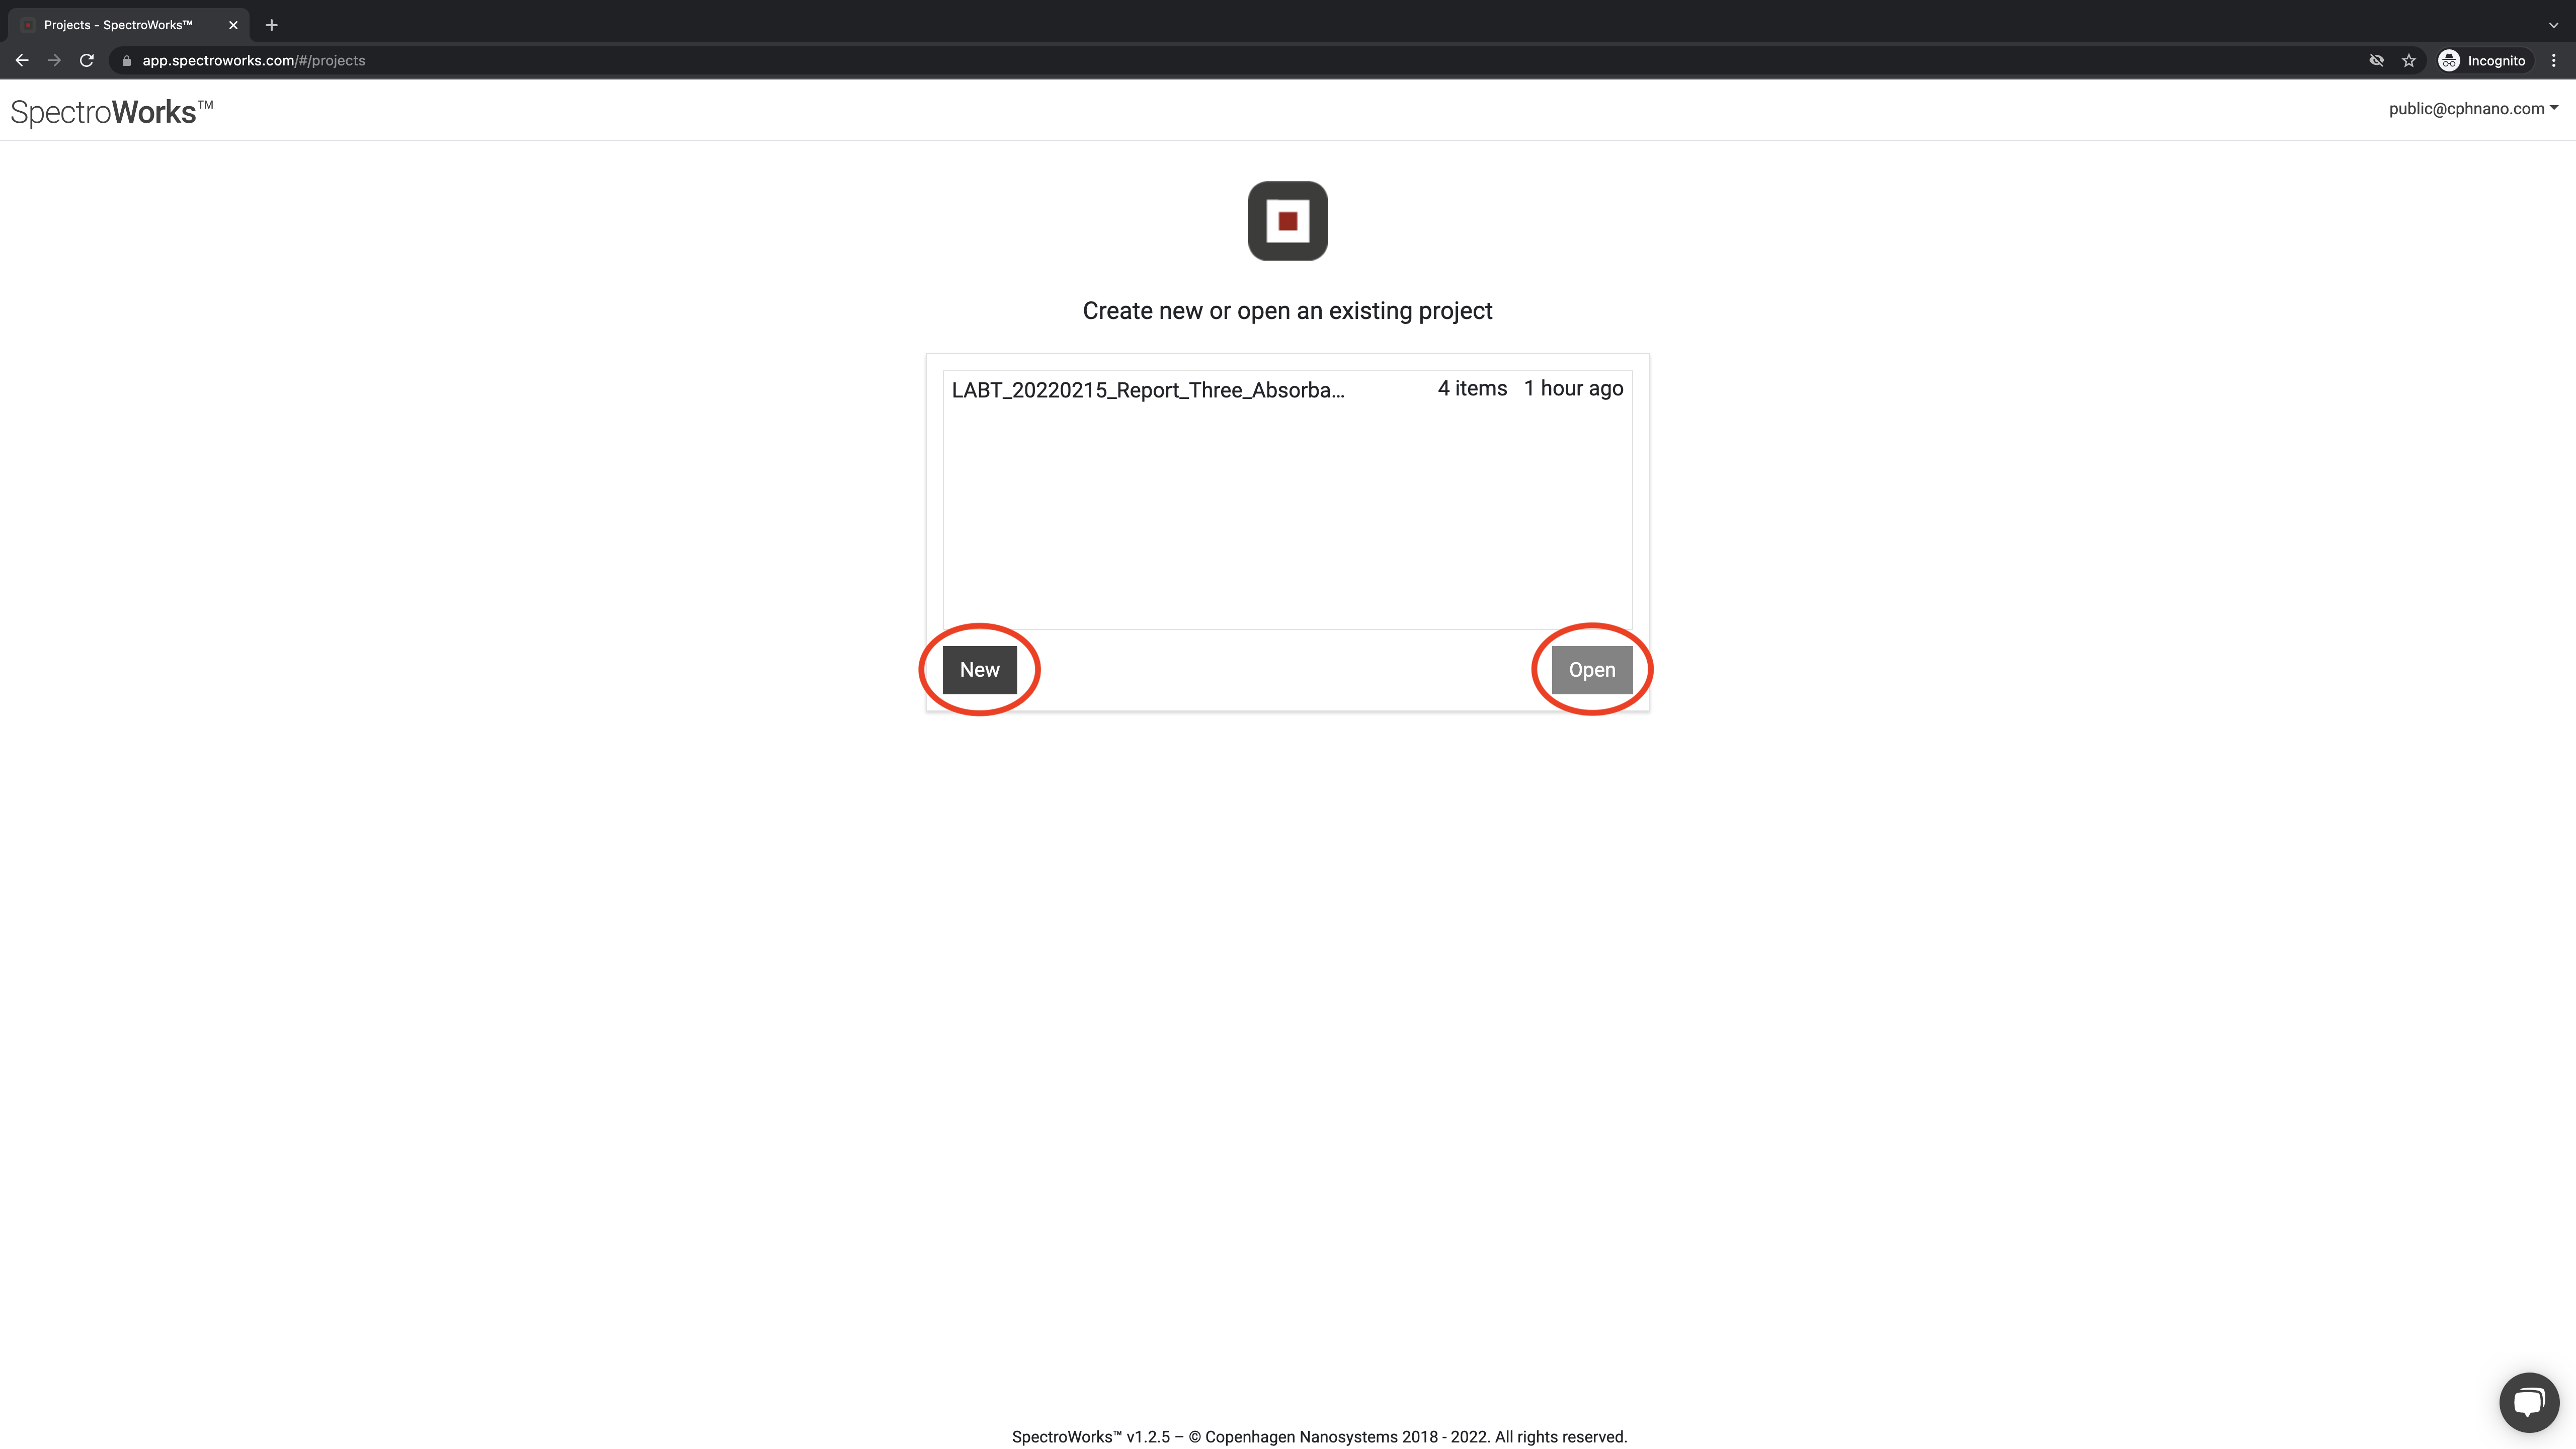
After you log in, choose NEW or OPEN an existing project.
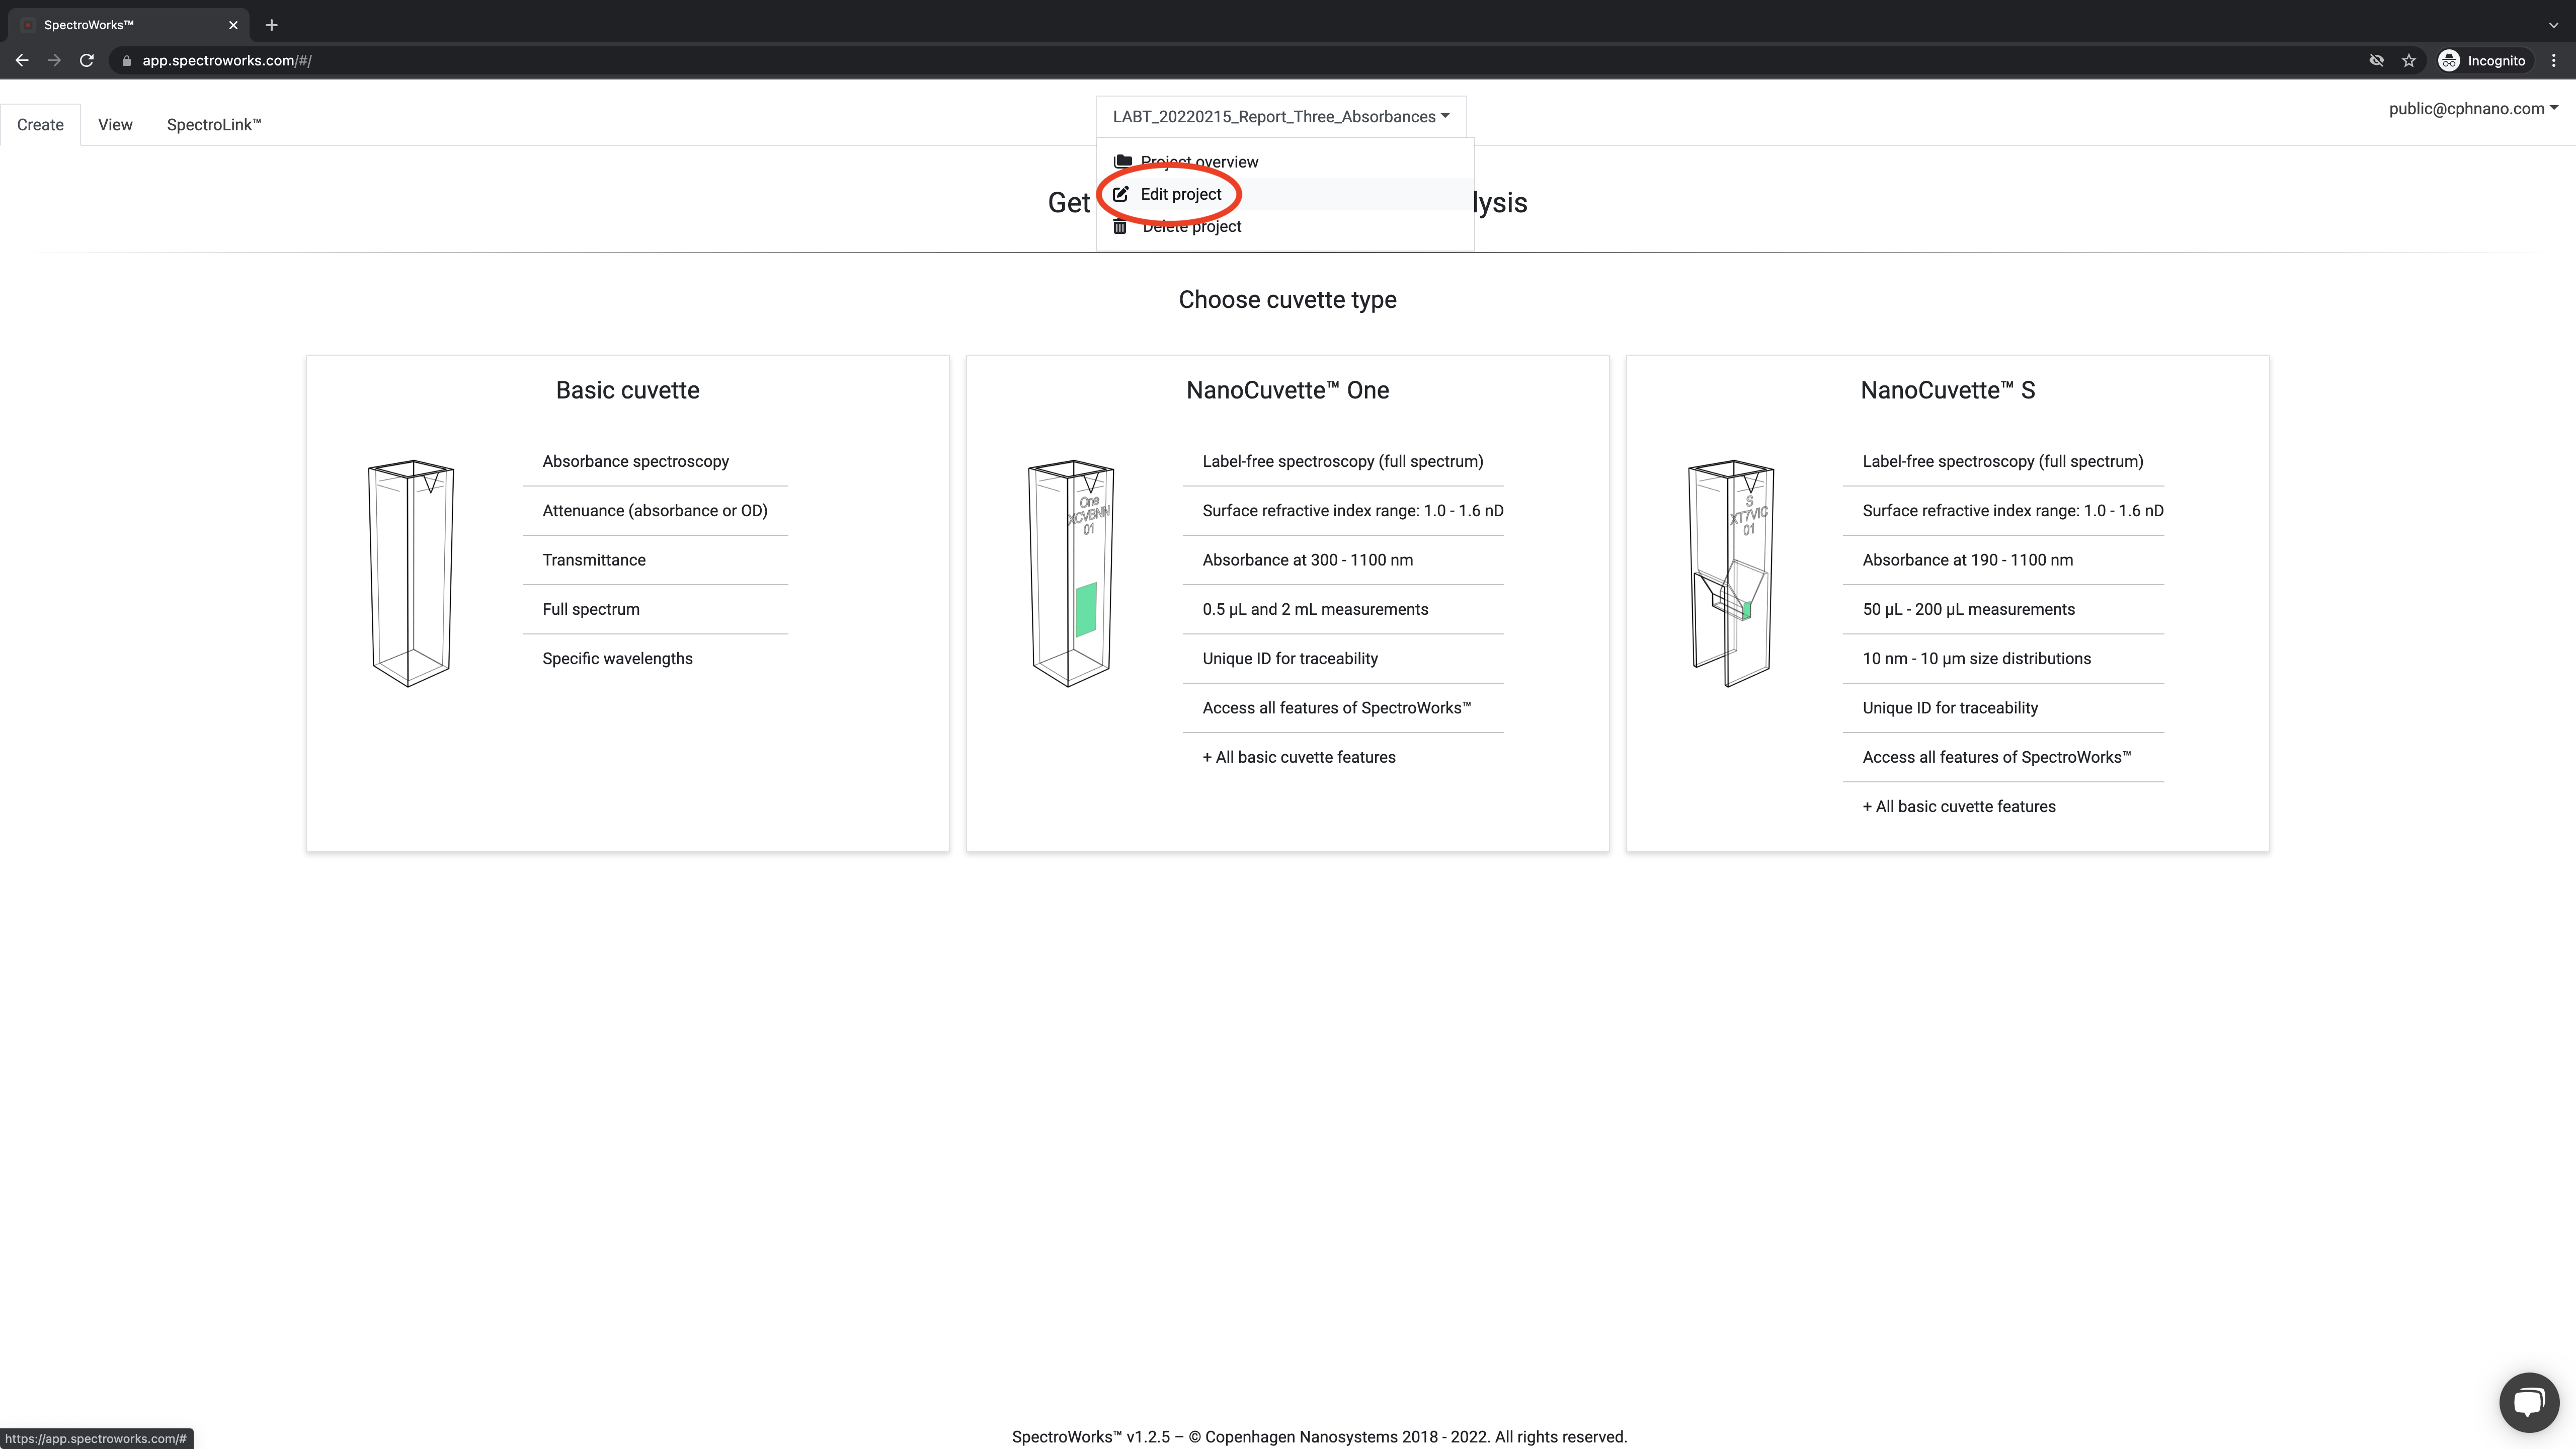
Step 03: Select your three absorbances in SpectroWorks™
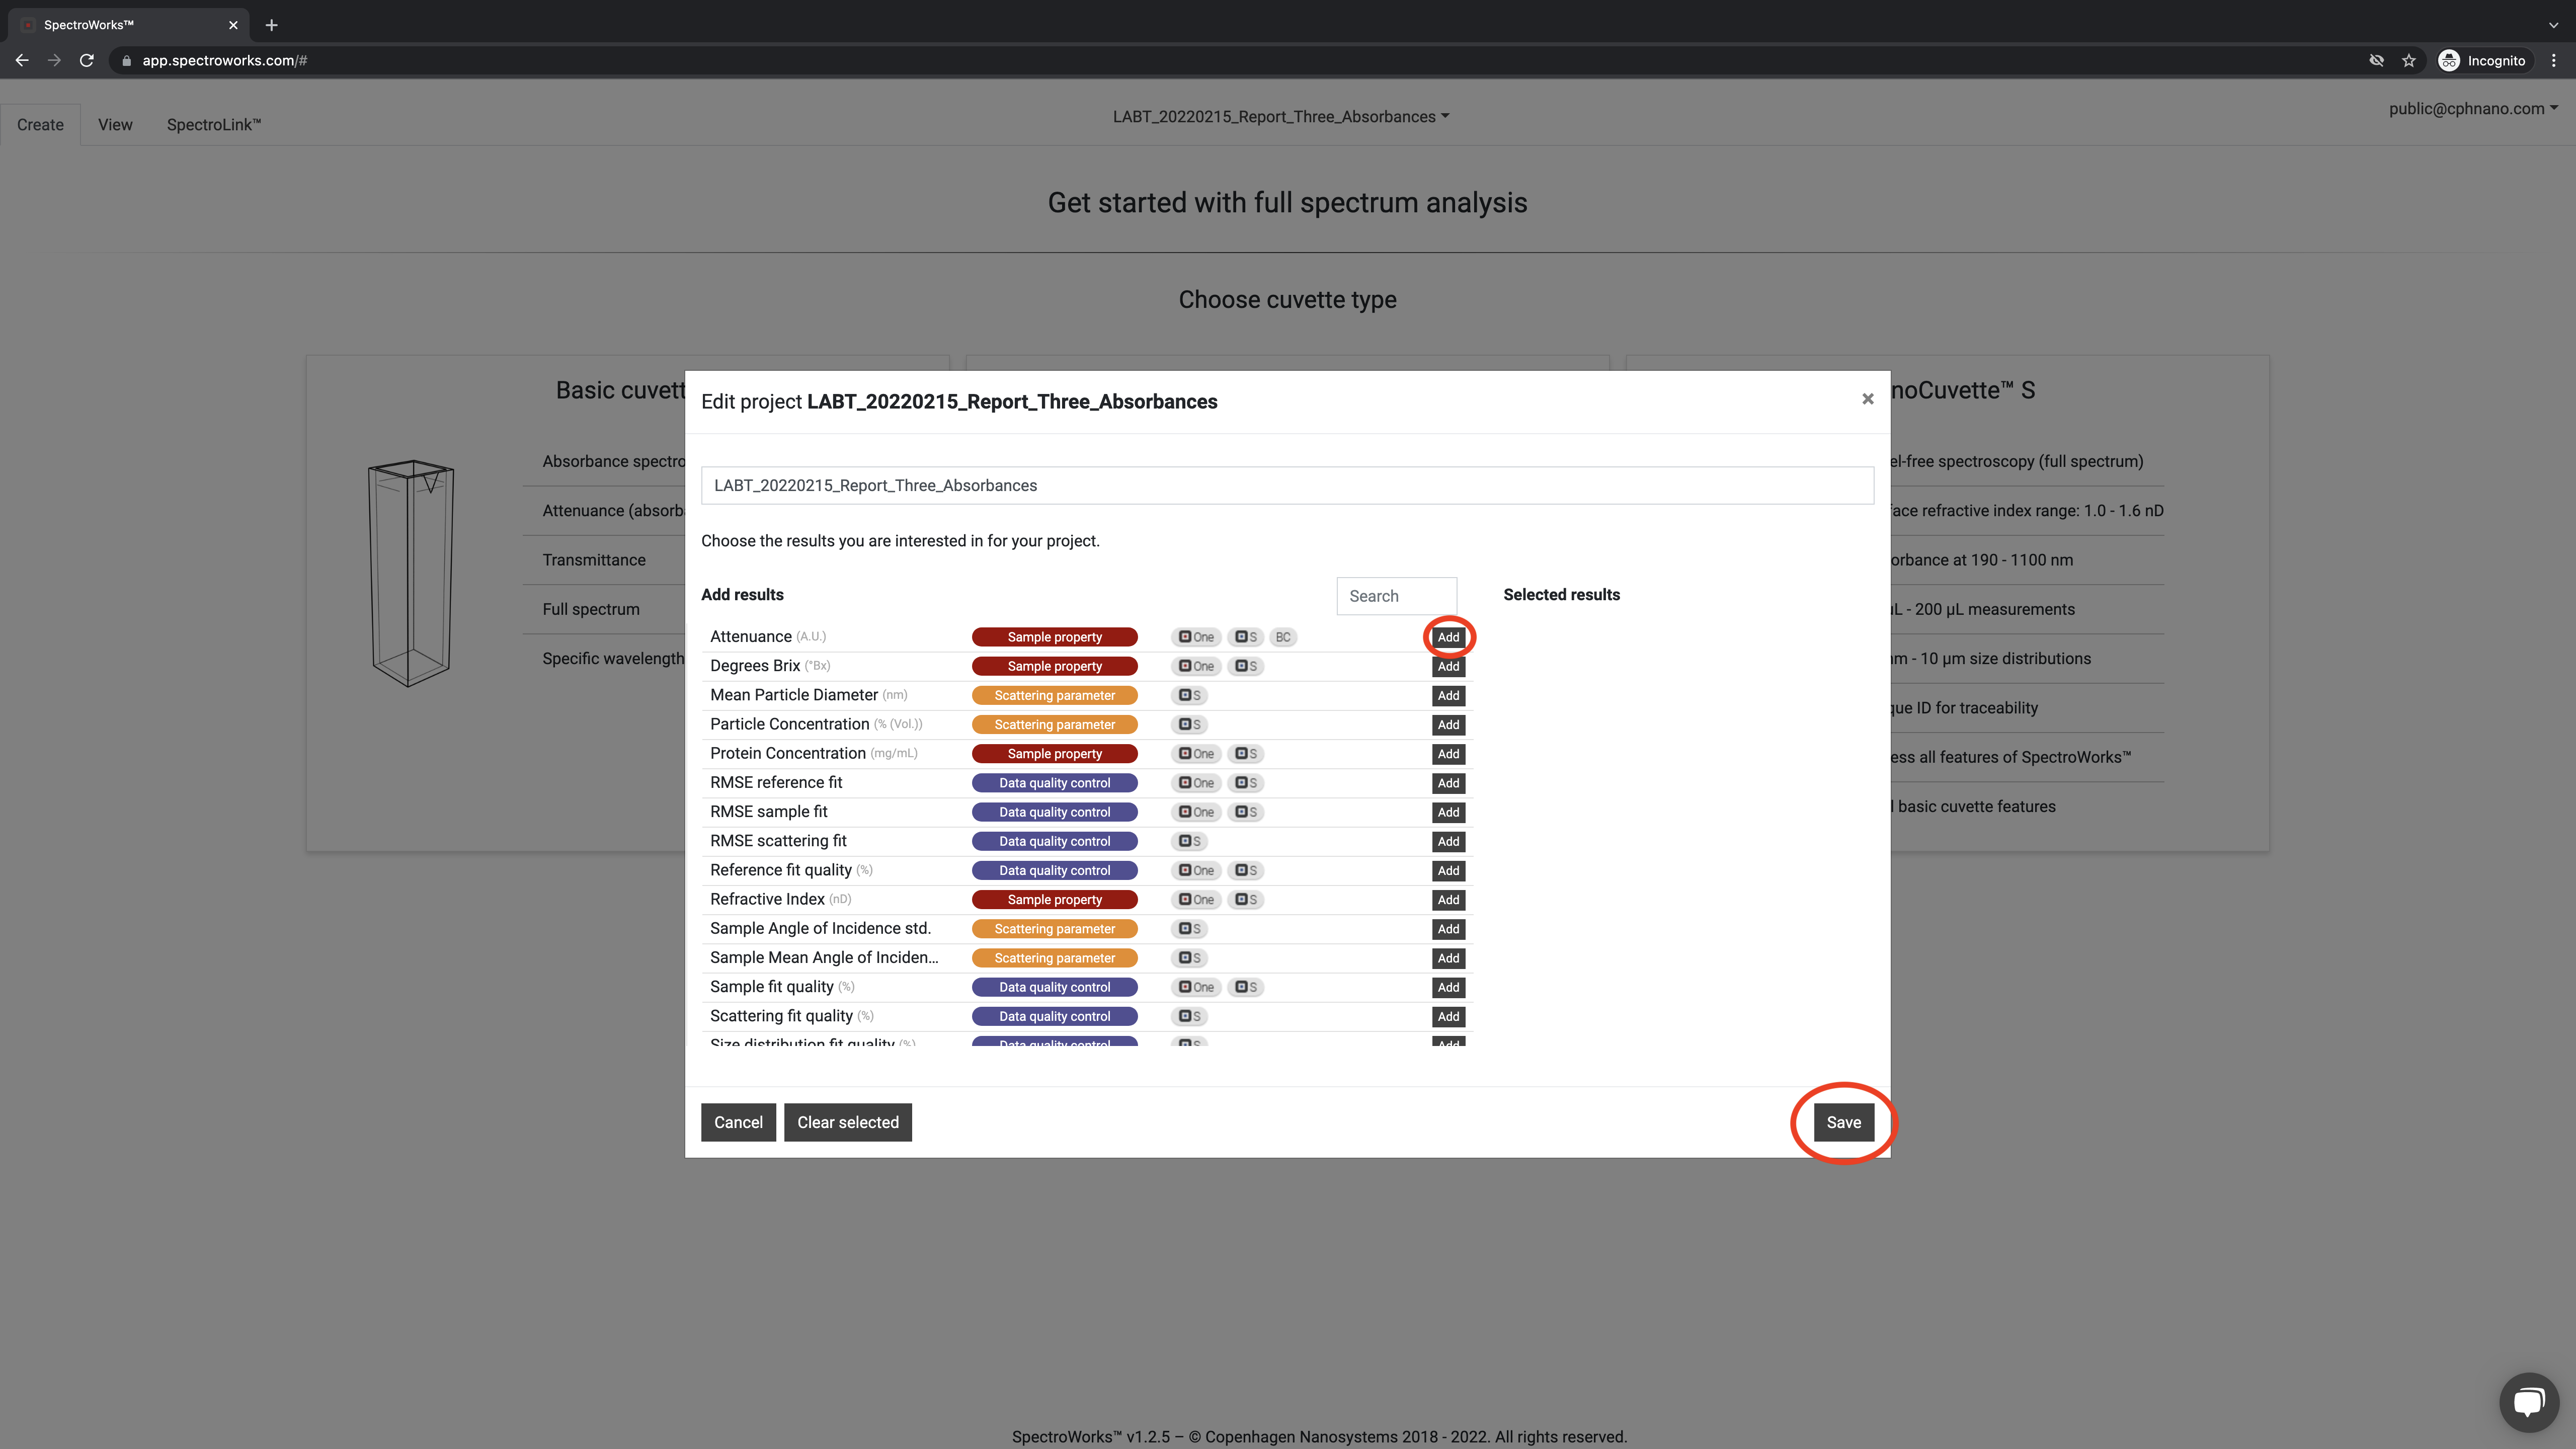
After setting up a new project, select Edit project to setup which parameters should be measured.
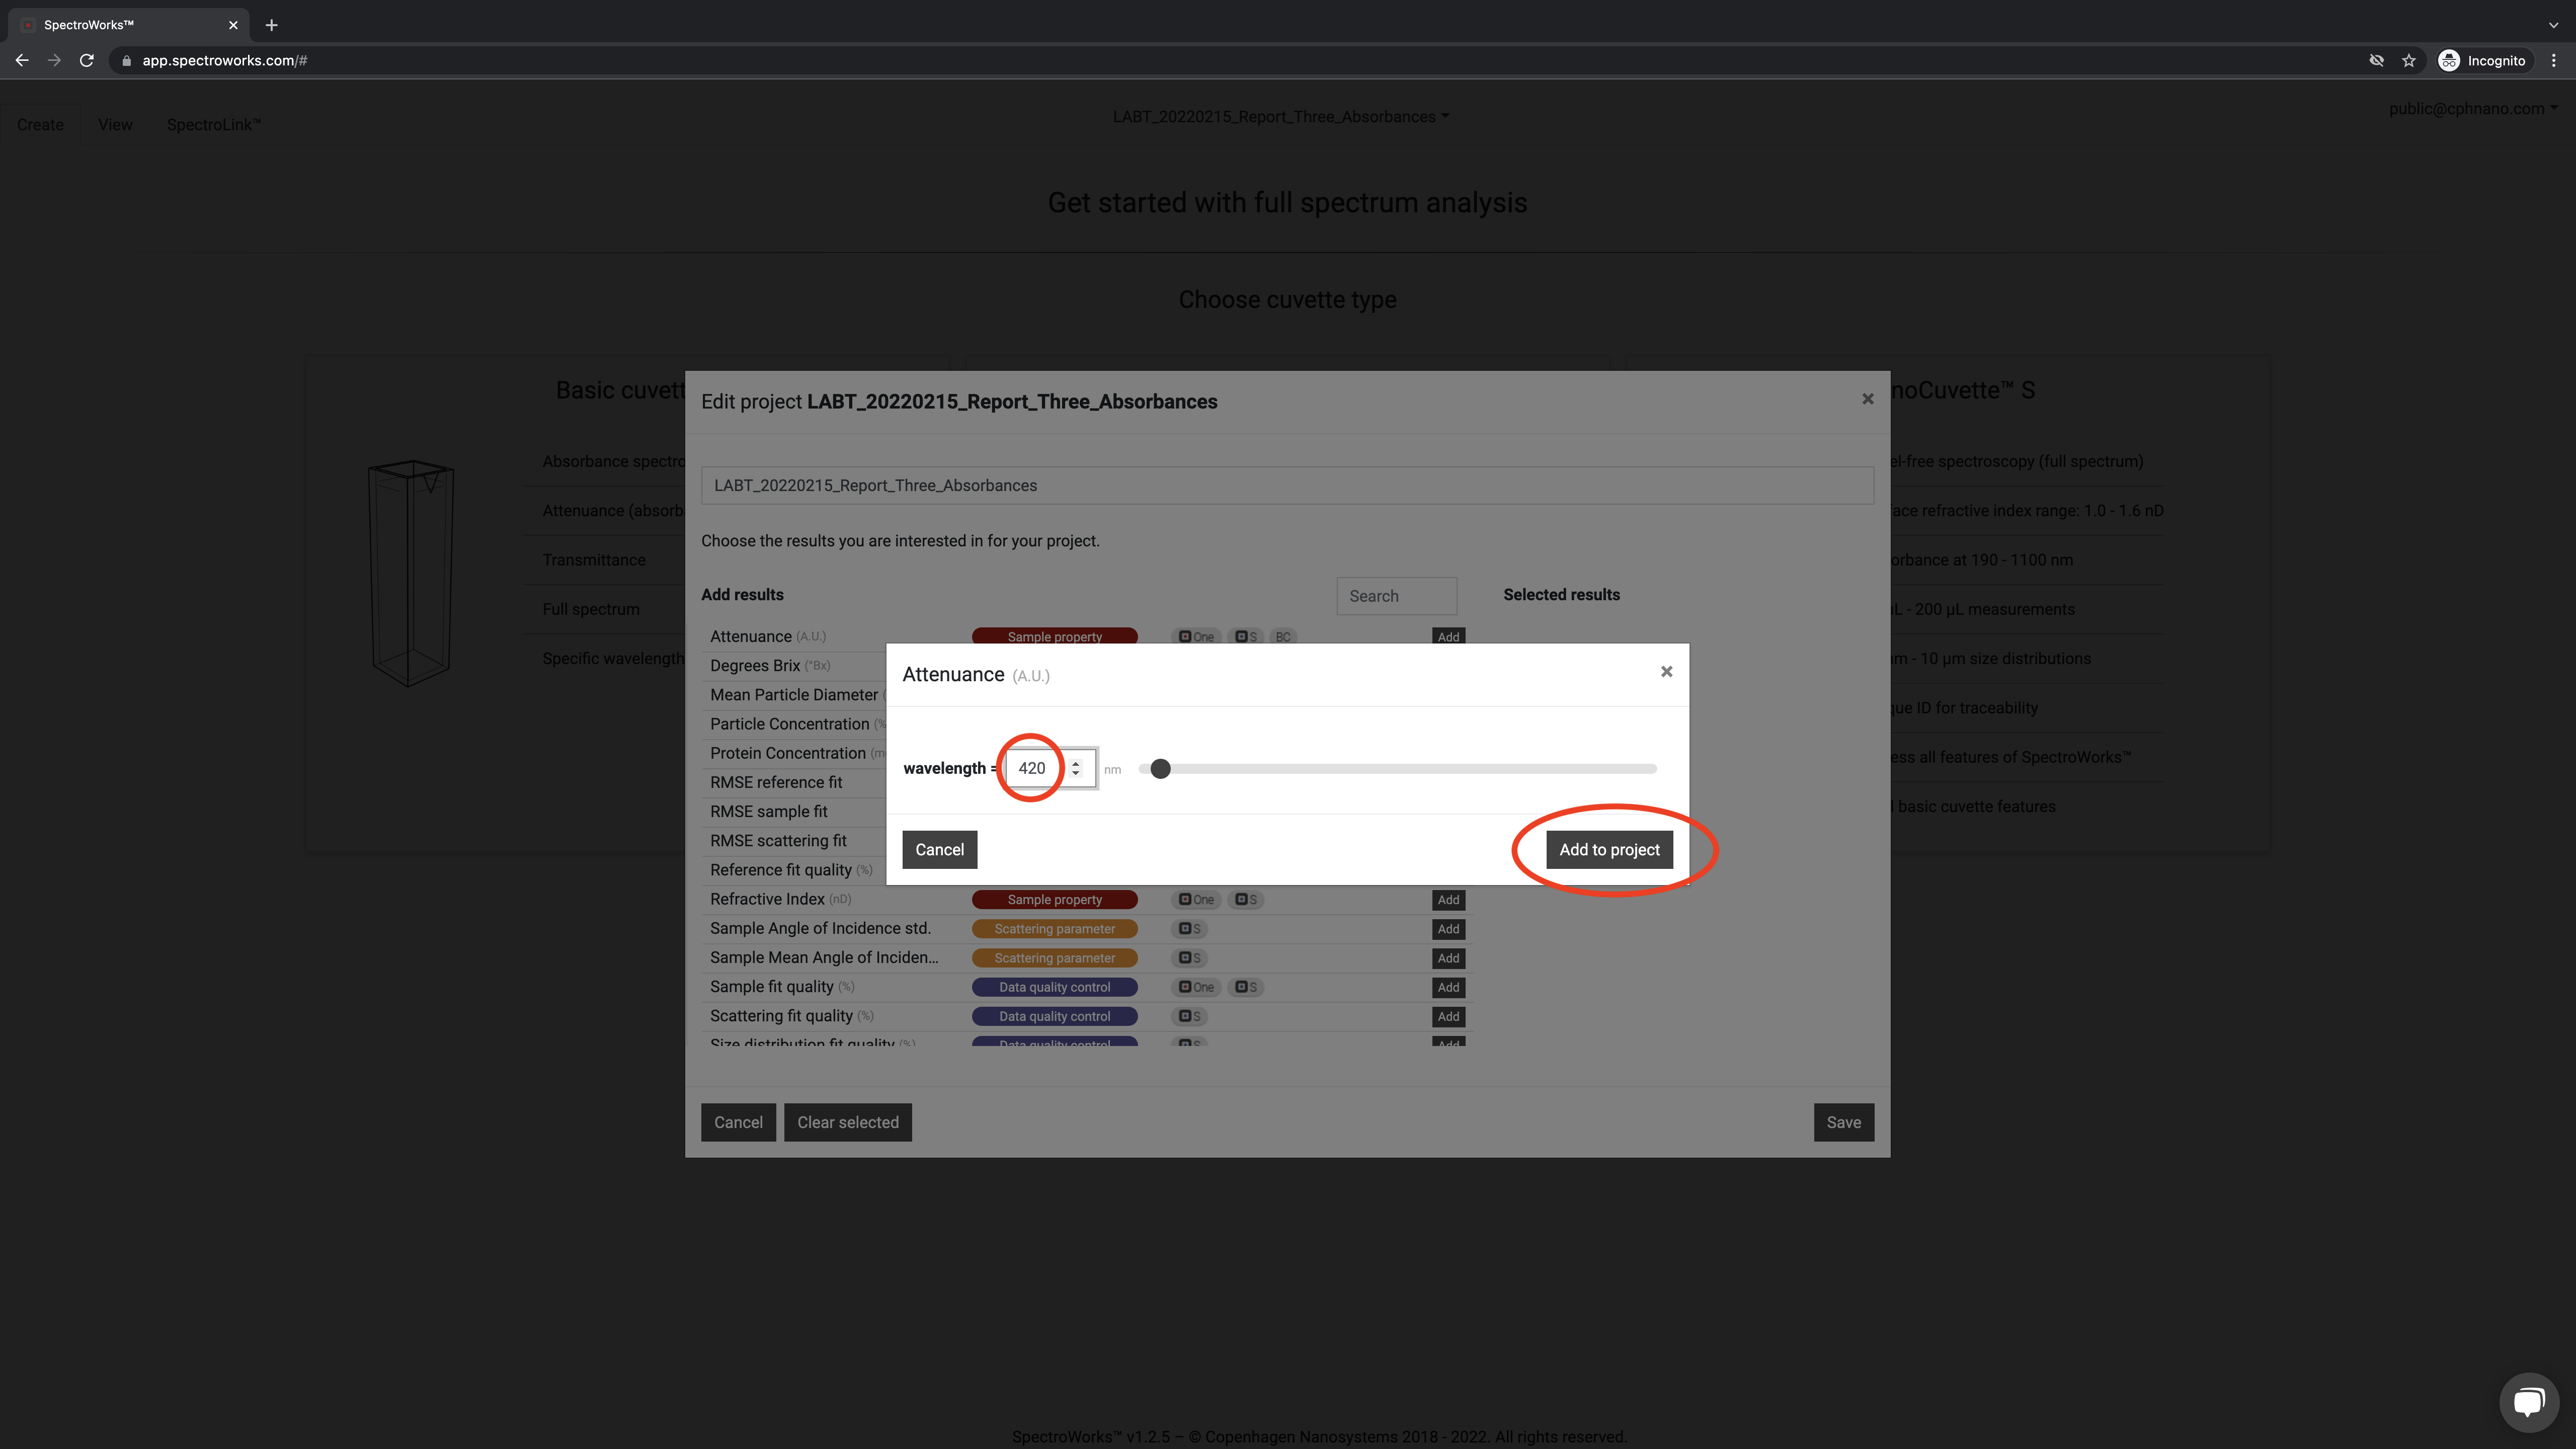
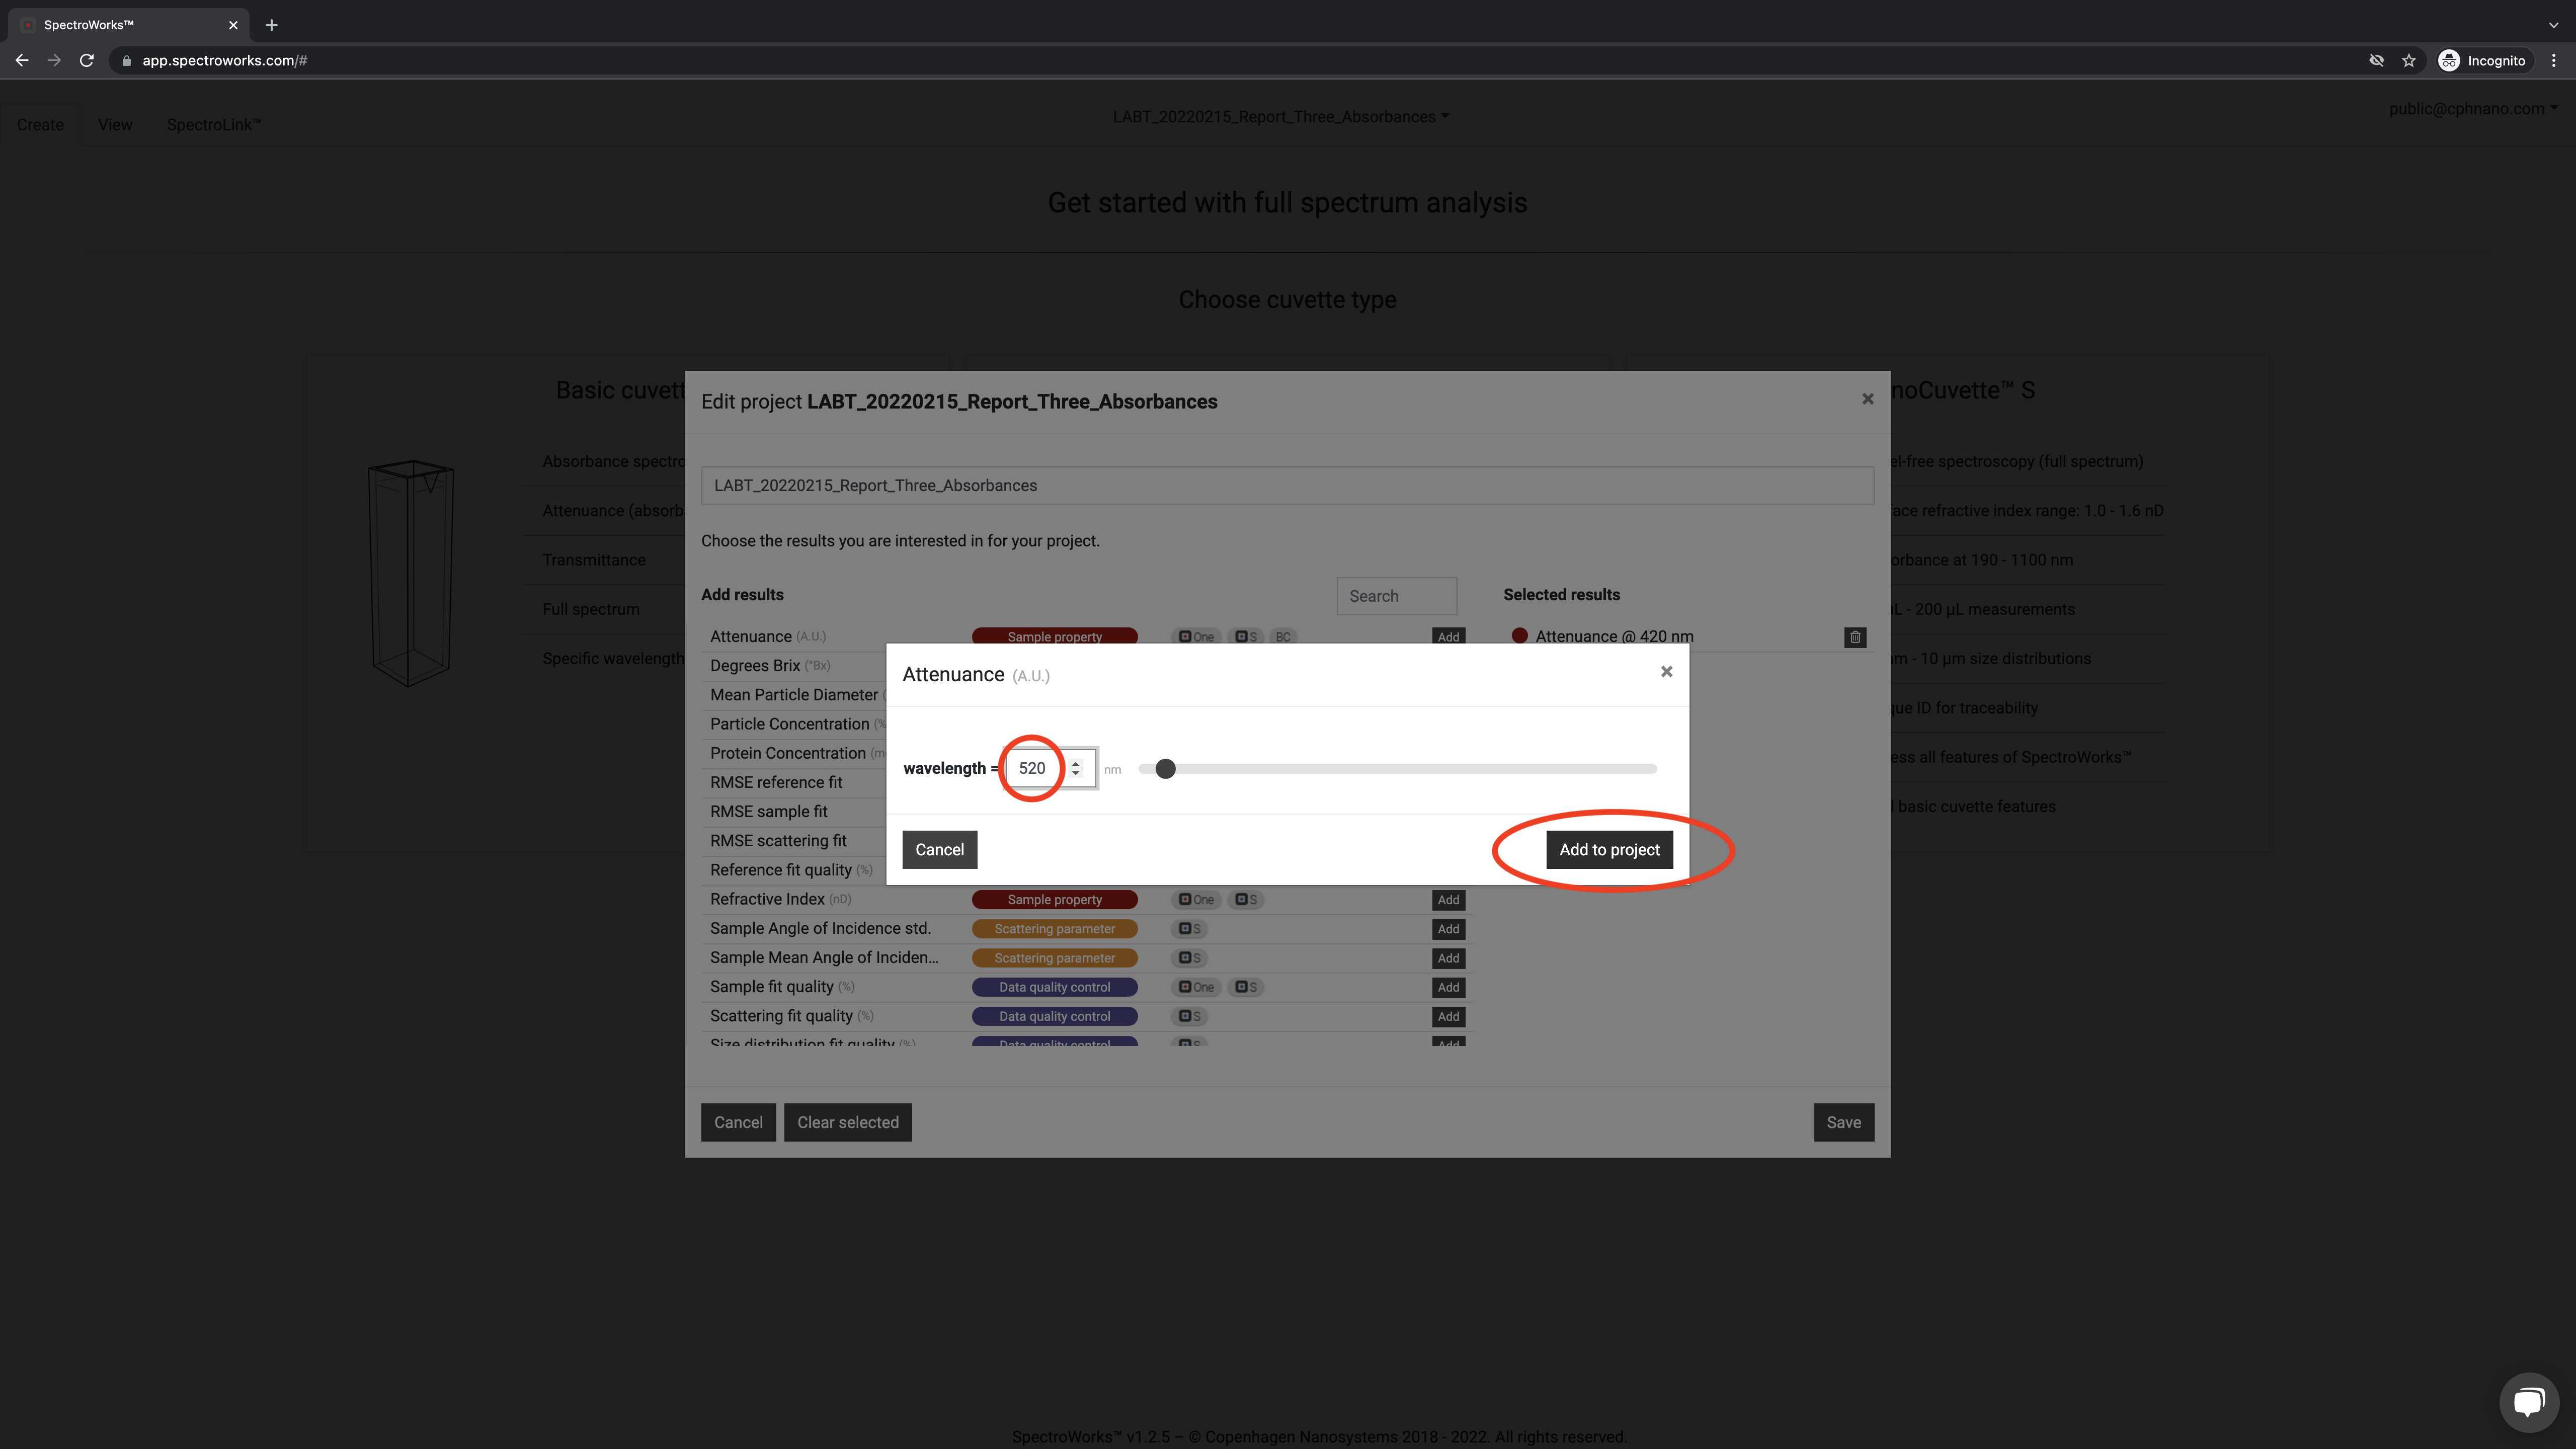
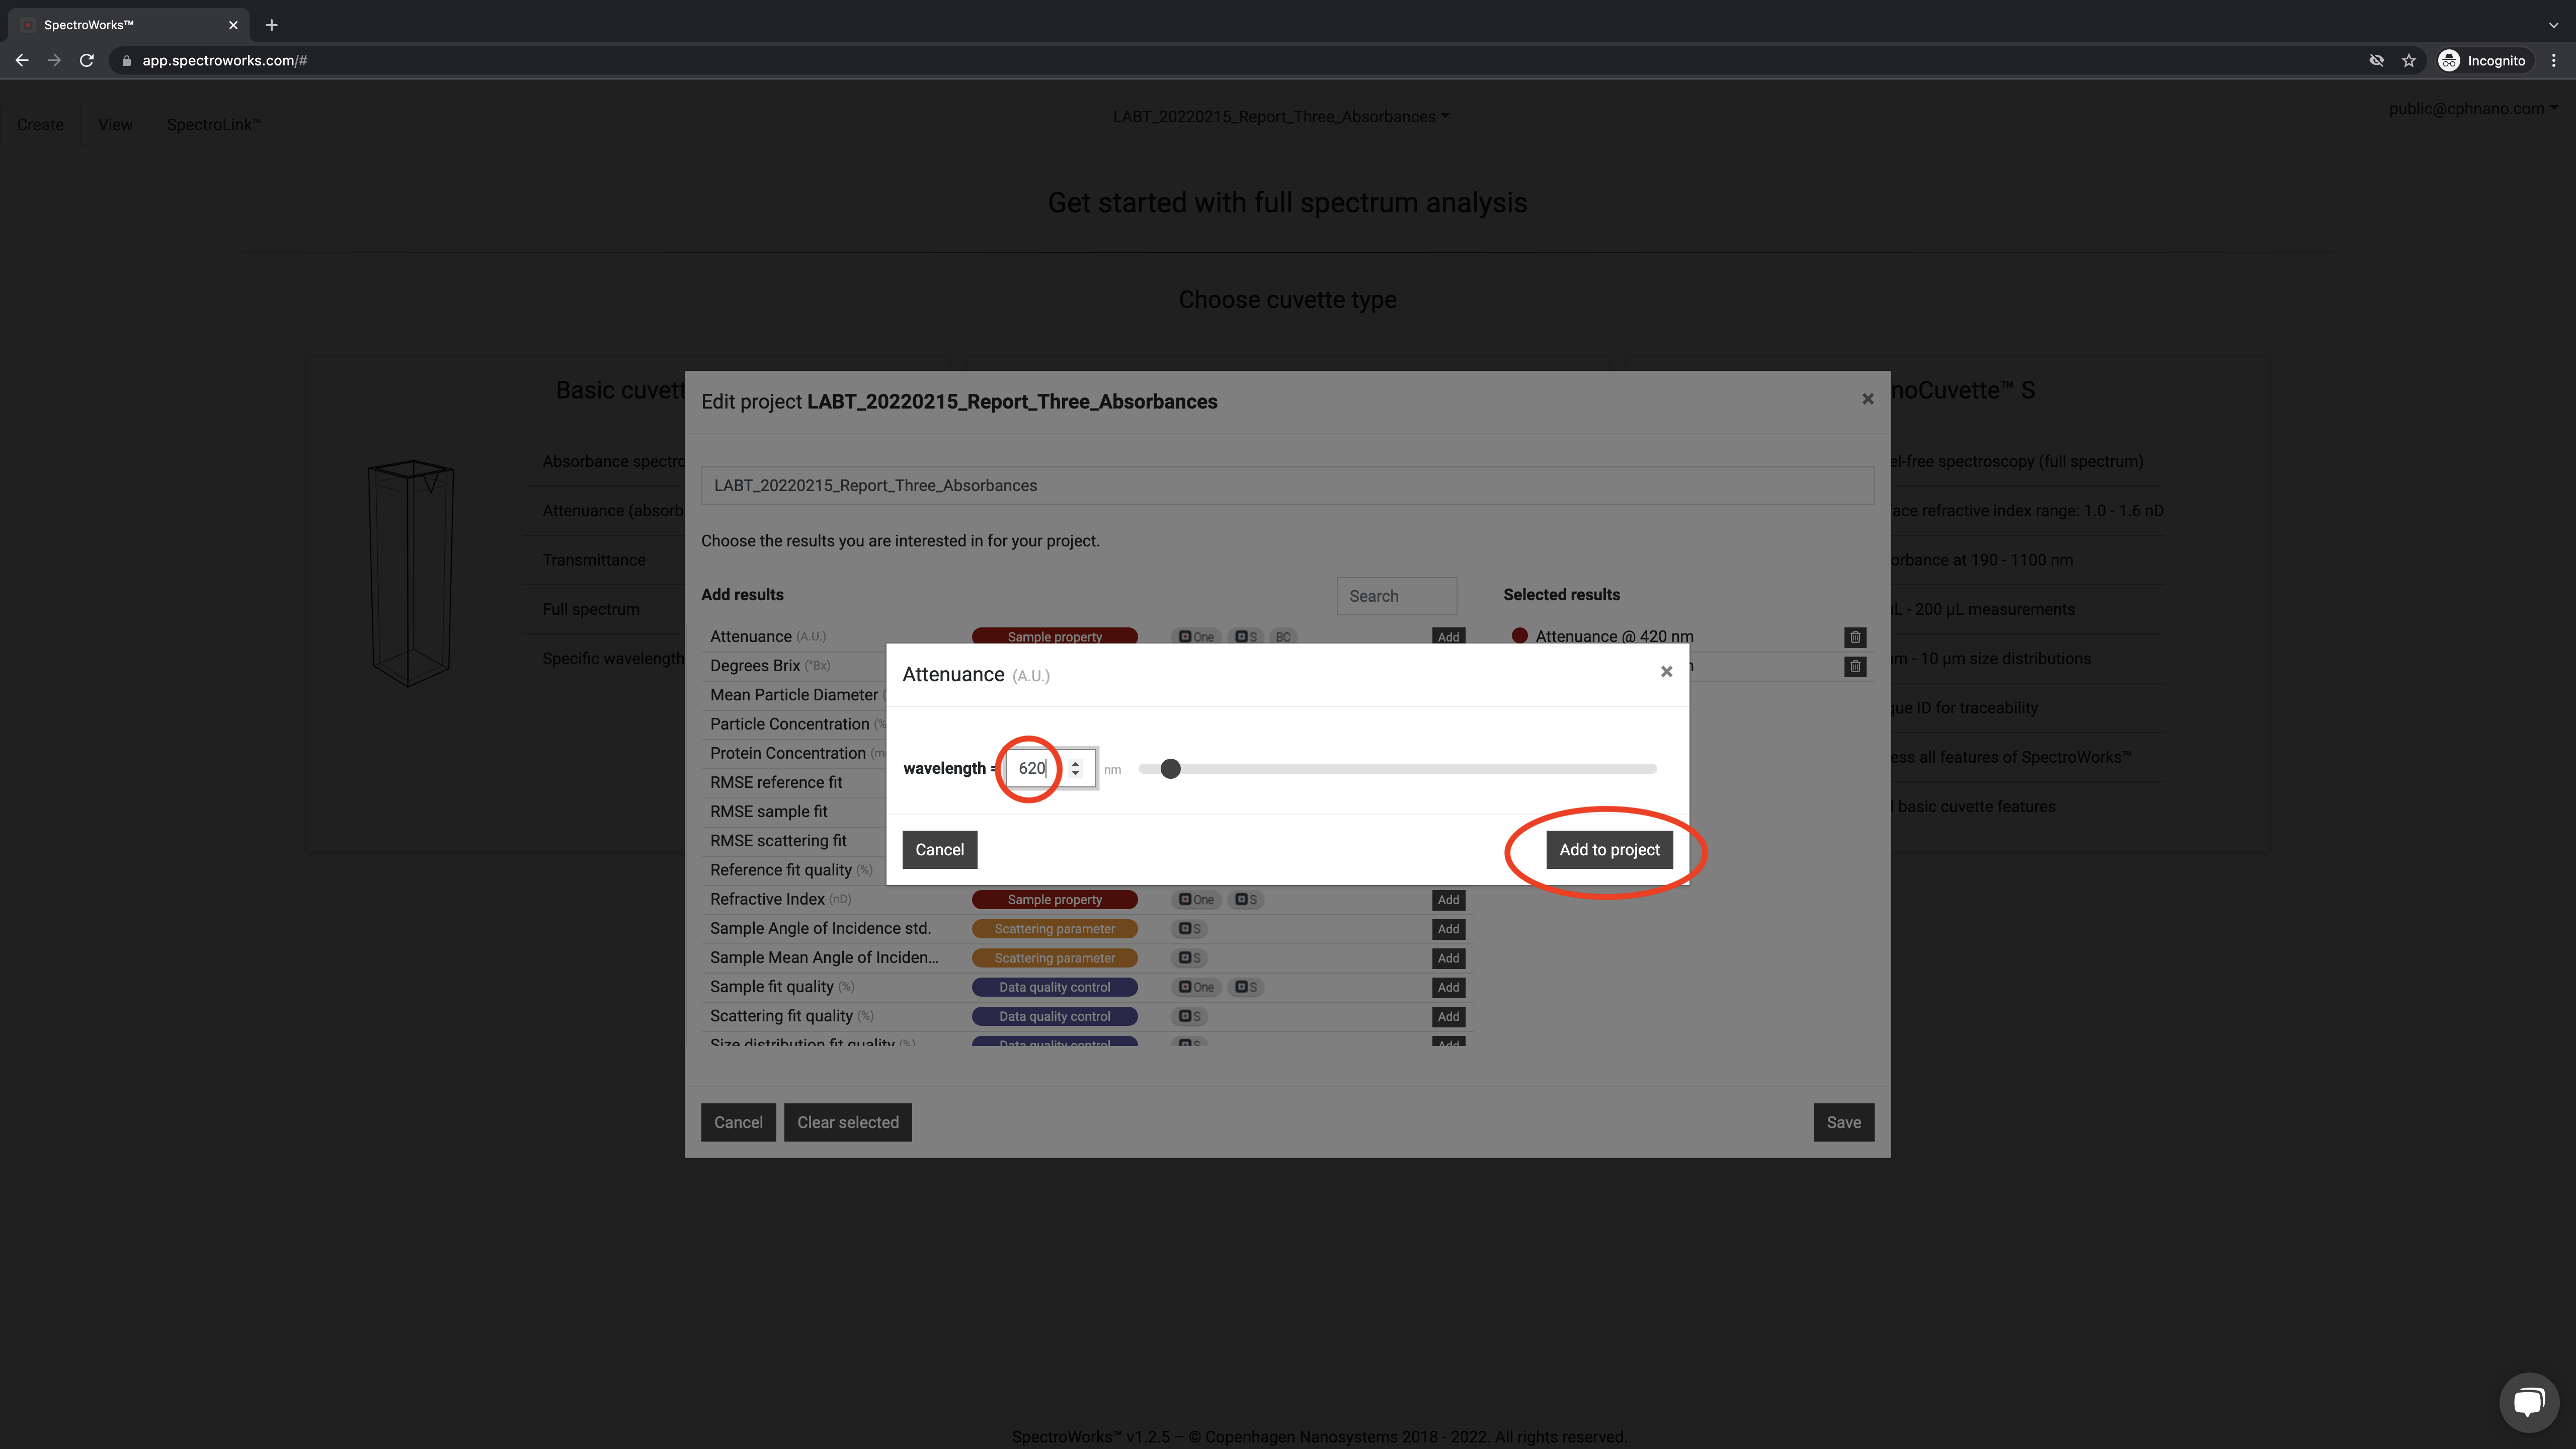
Step 04: Select absorbances of 420 nm, 520 nm and 620 nm in SpectroWorks™
Select to add absorbances and then select the different values.
Next select your wavelength and click ADD TO PROJECT. Repeat for every wavelength you want to analyze.
Step 05: Upload spectral absorbance data into SpectroWorks™
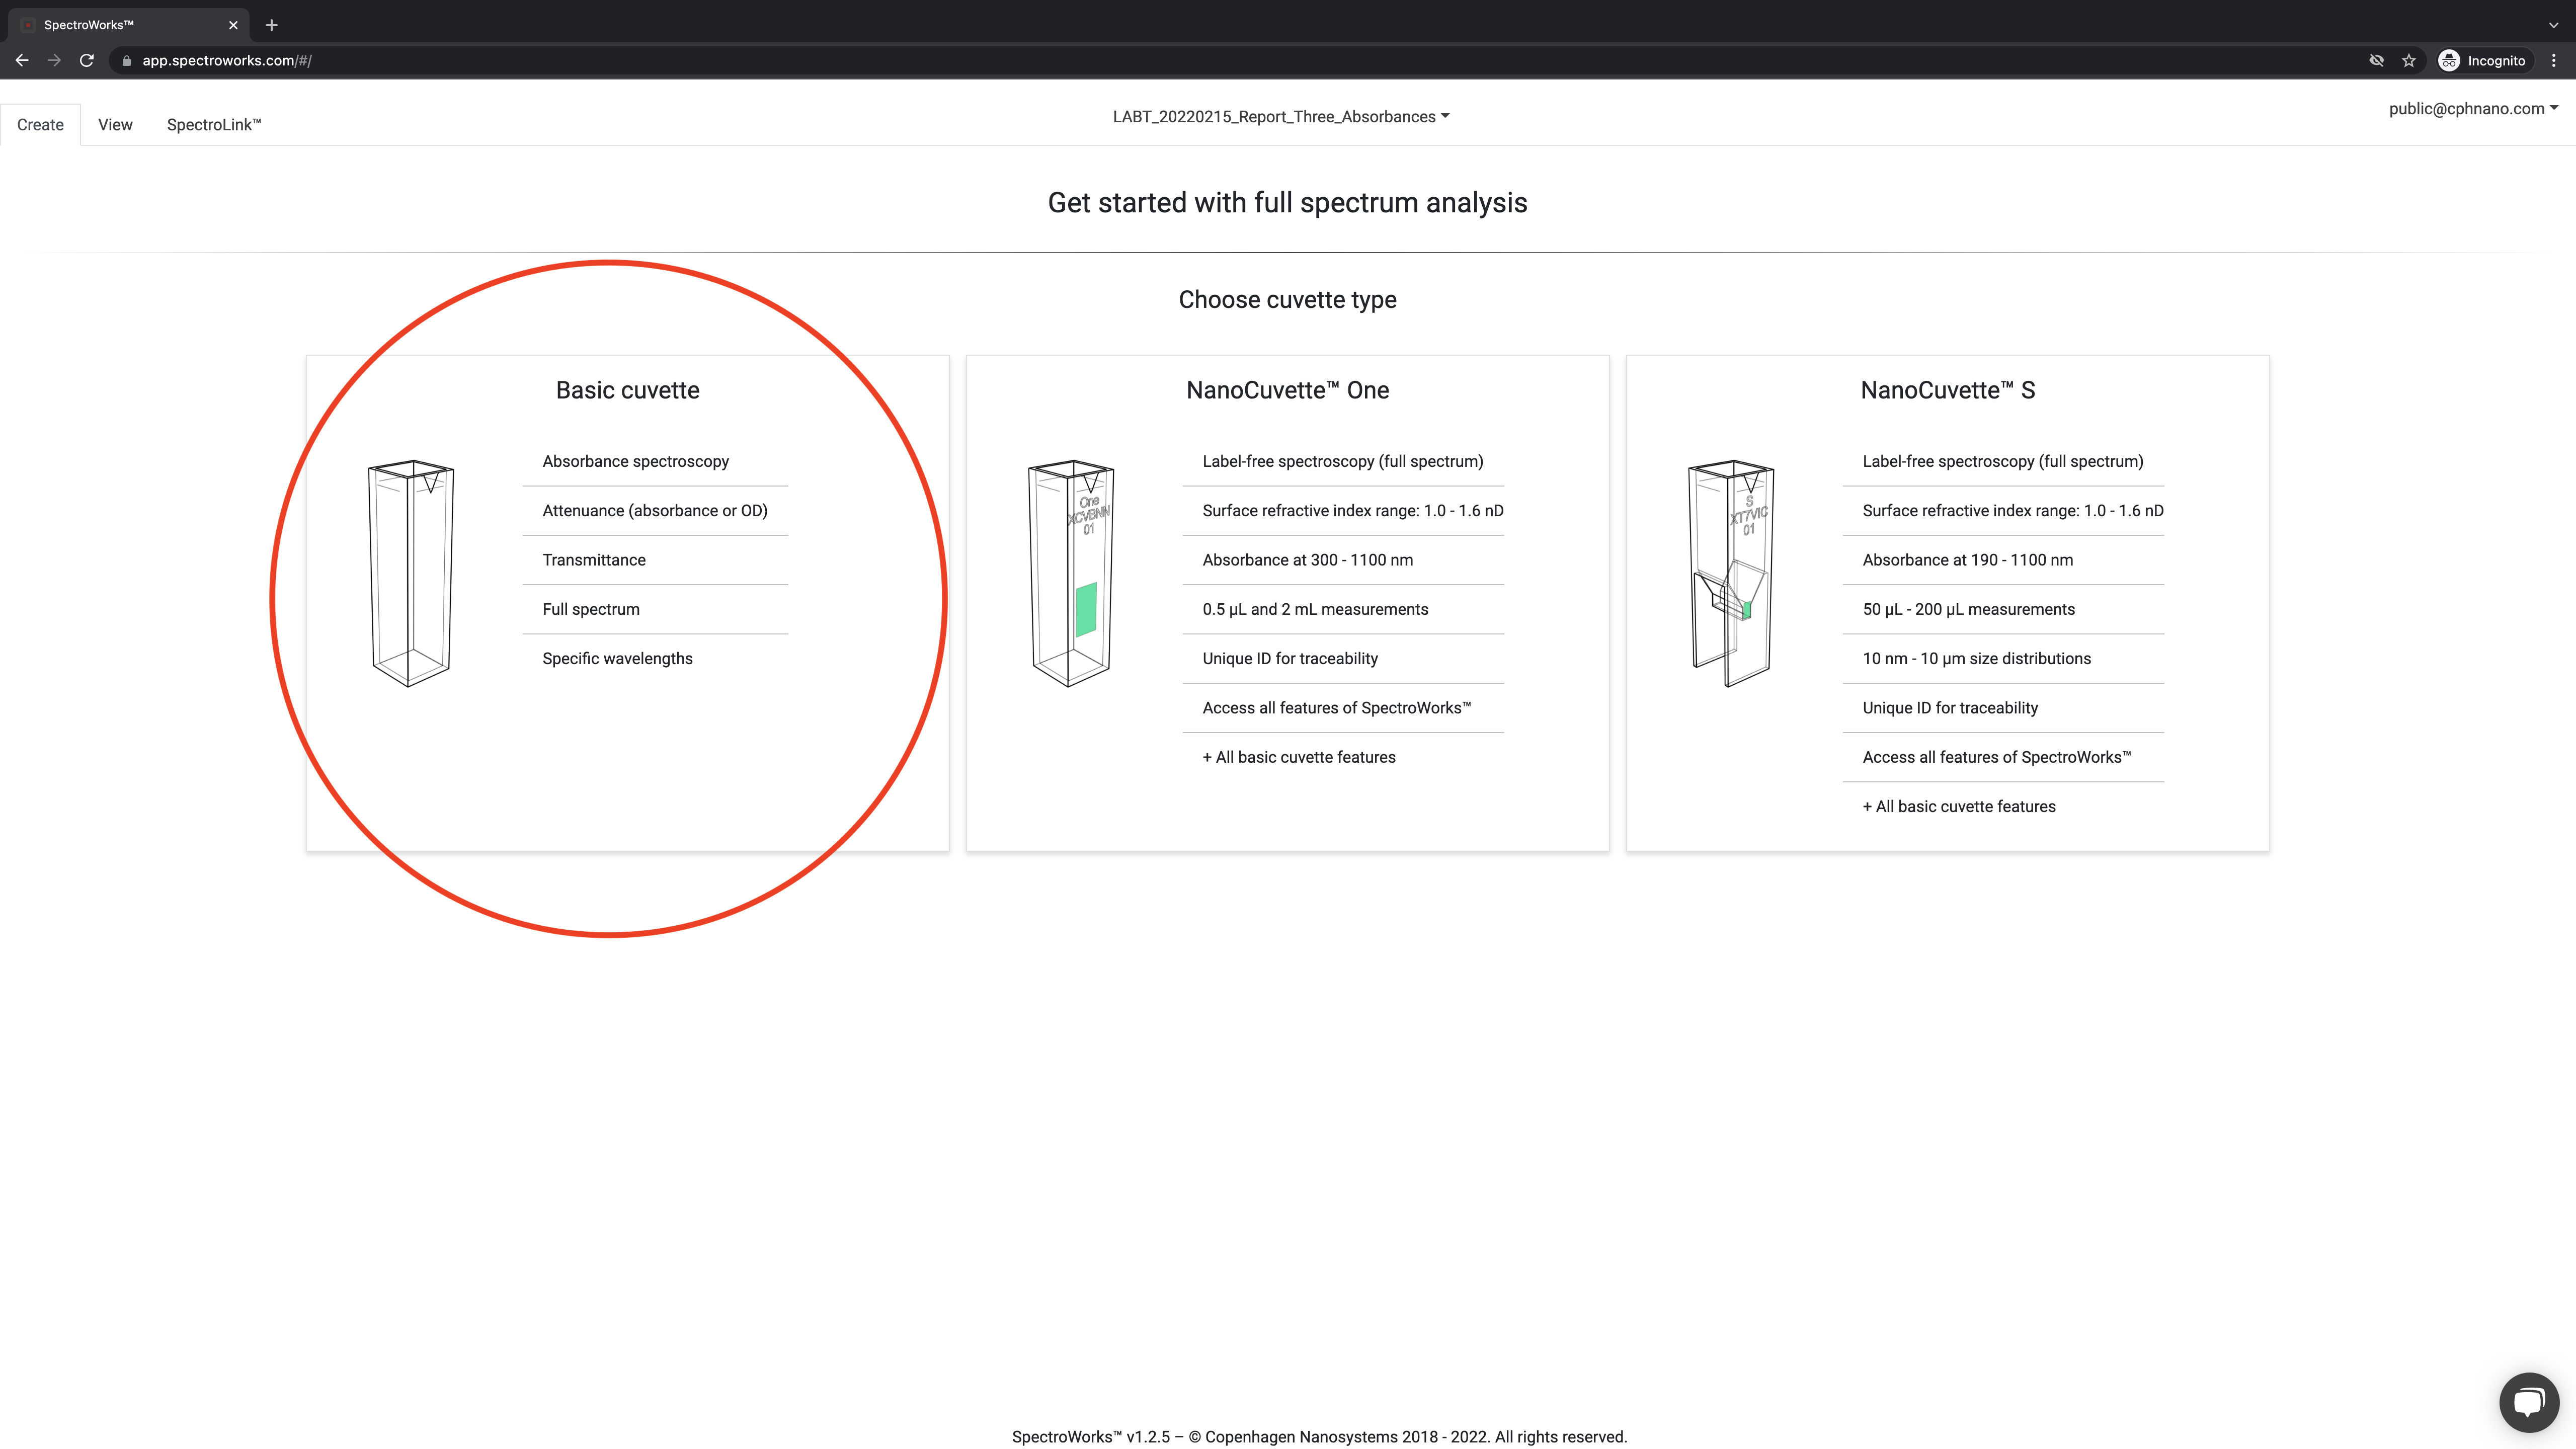
Start creating new Basic Cuvette items in SpectroWorks by uploading data.
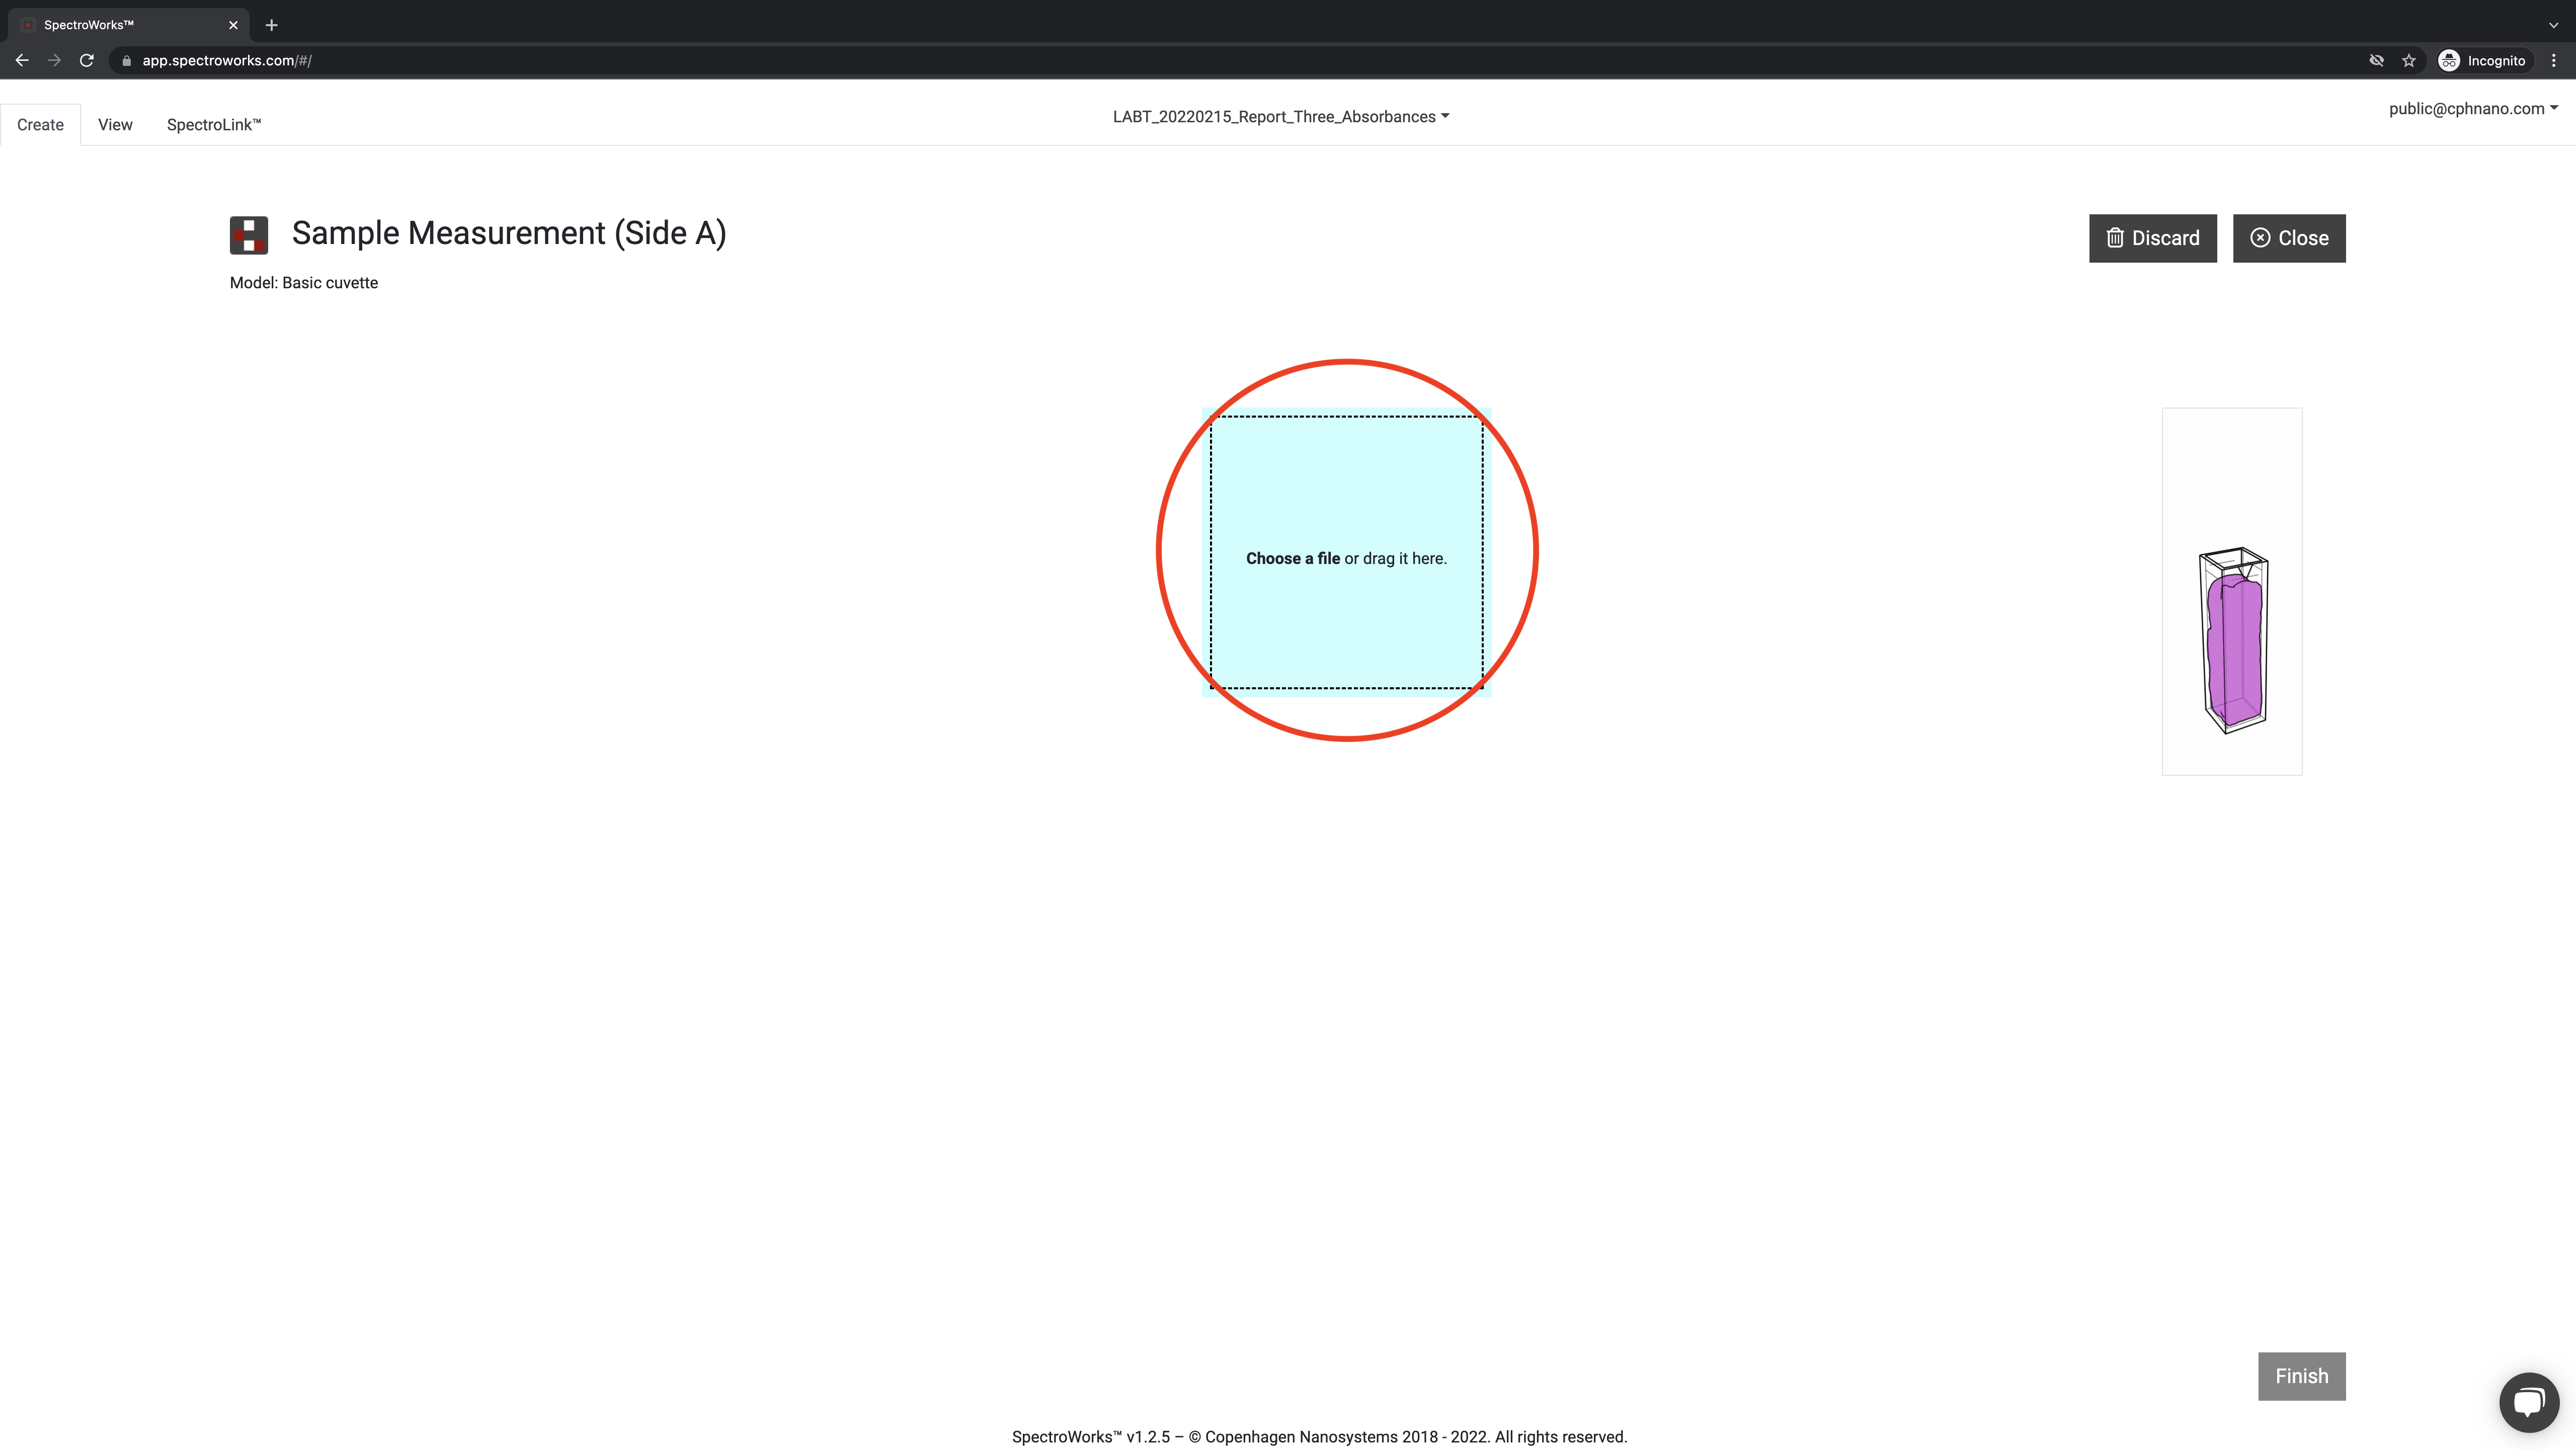
Next upload your spectrum to SpectroWorks™ by drag-and-drop the file or use a file browser. Alternatively, you can use SpectroLink™ to acquire the spectrum.
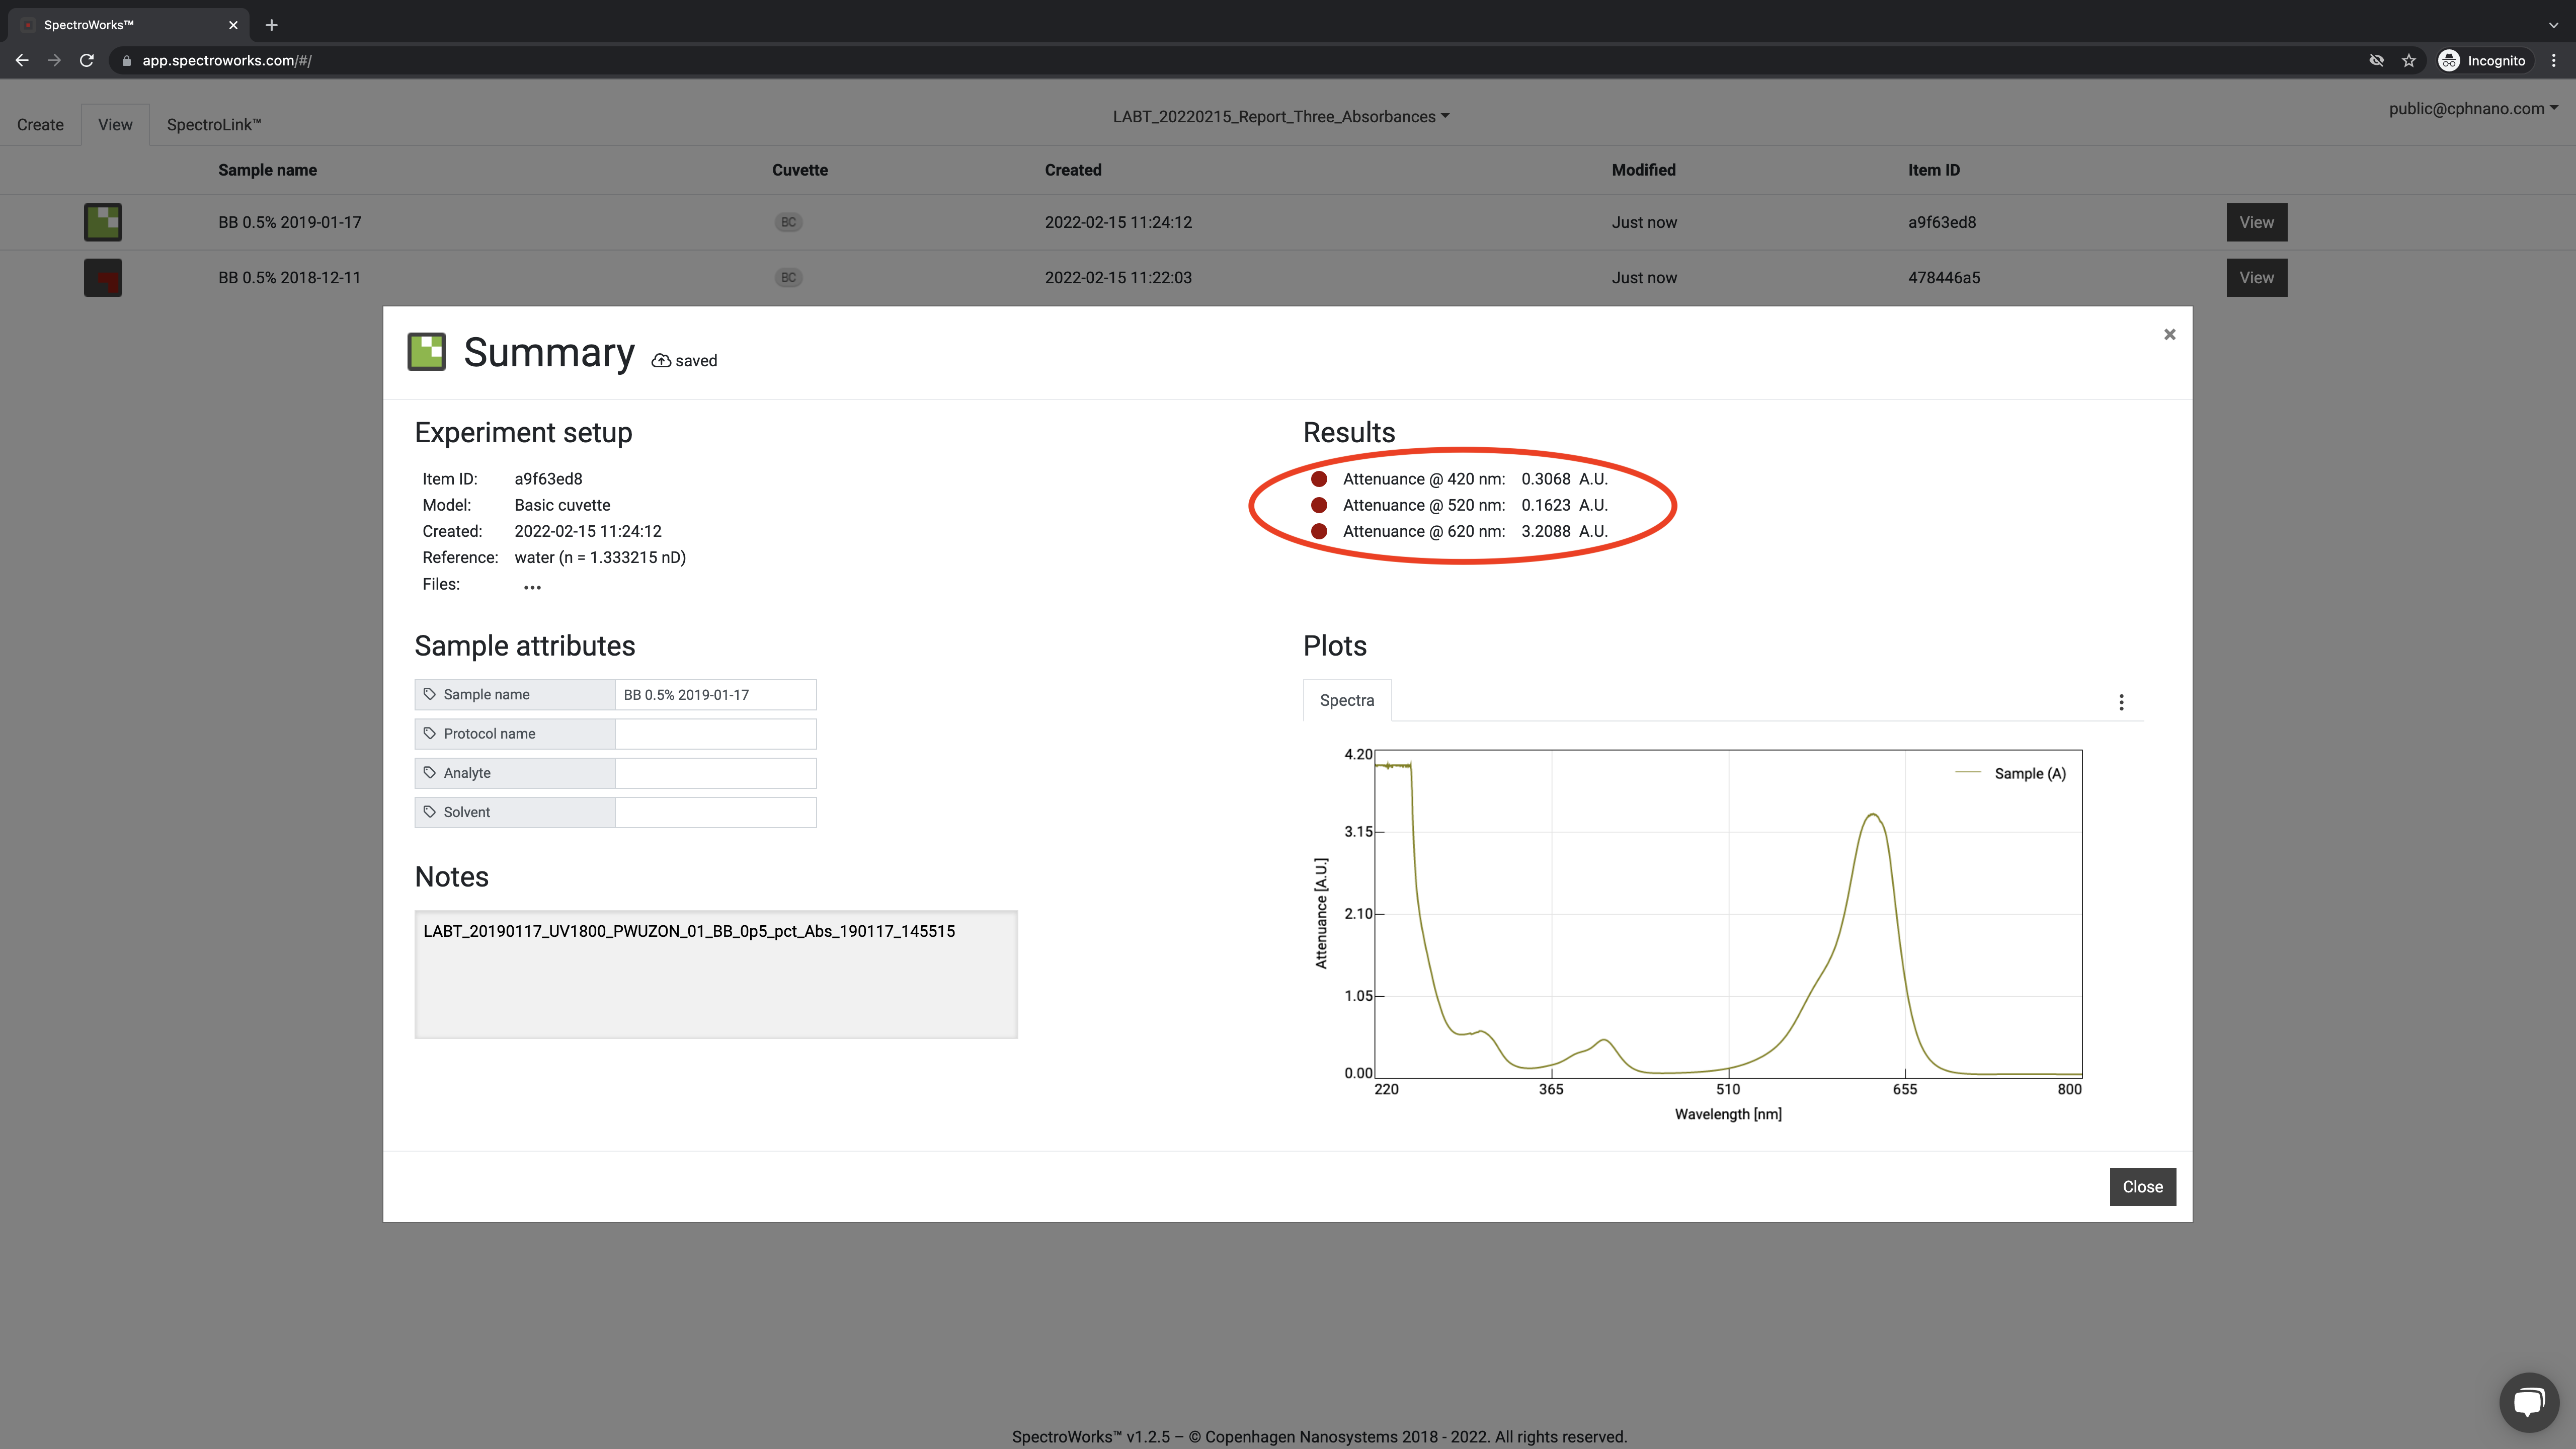
Step 06: See the result for each spectrum item in SpectroWorks™
Step 07: Setup API for accessing data outside SpectroWorks™
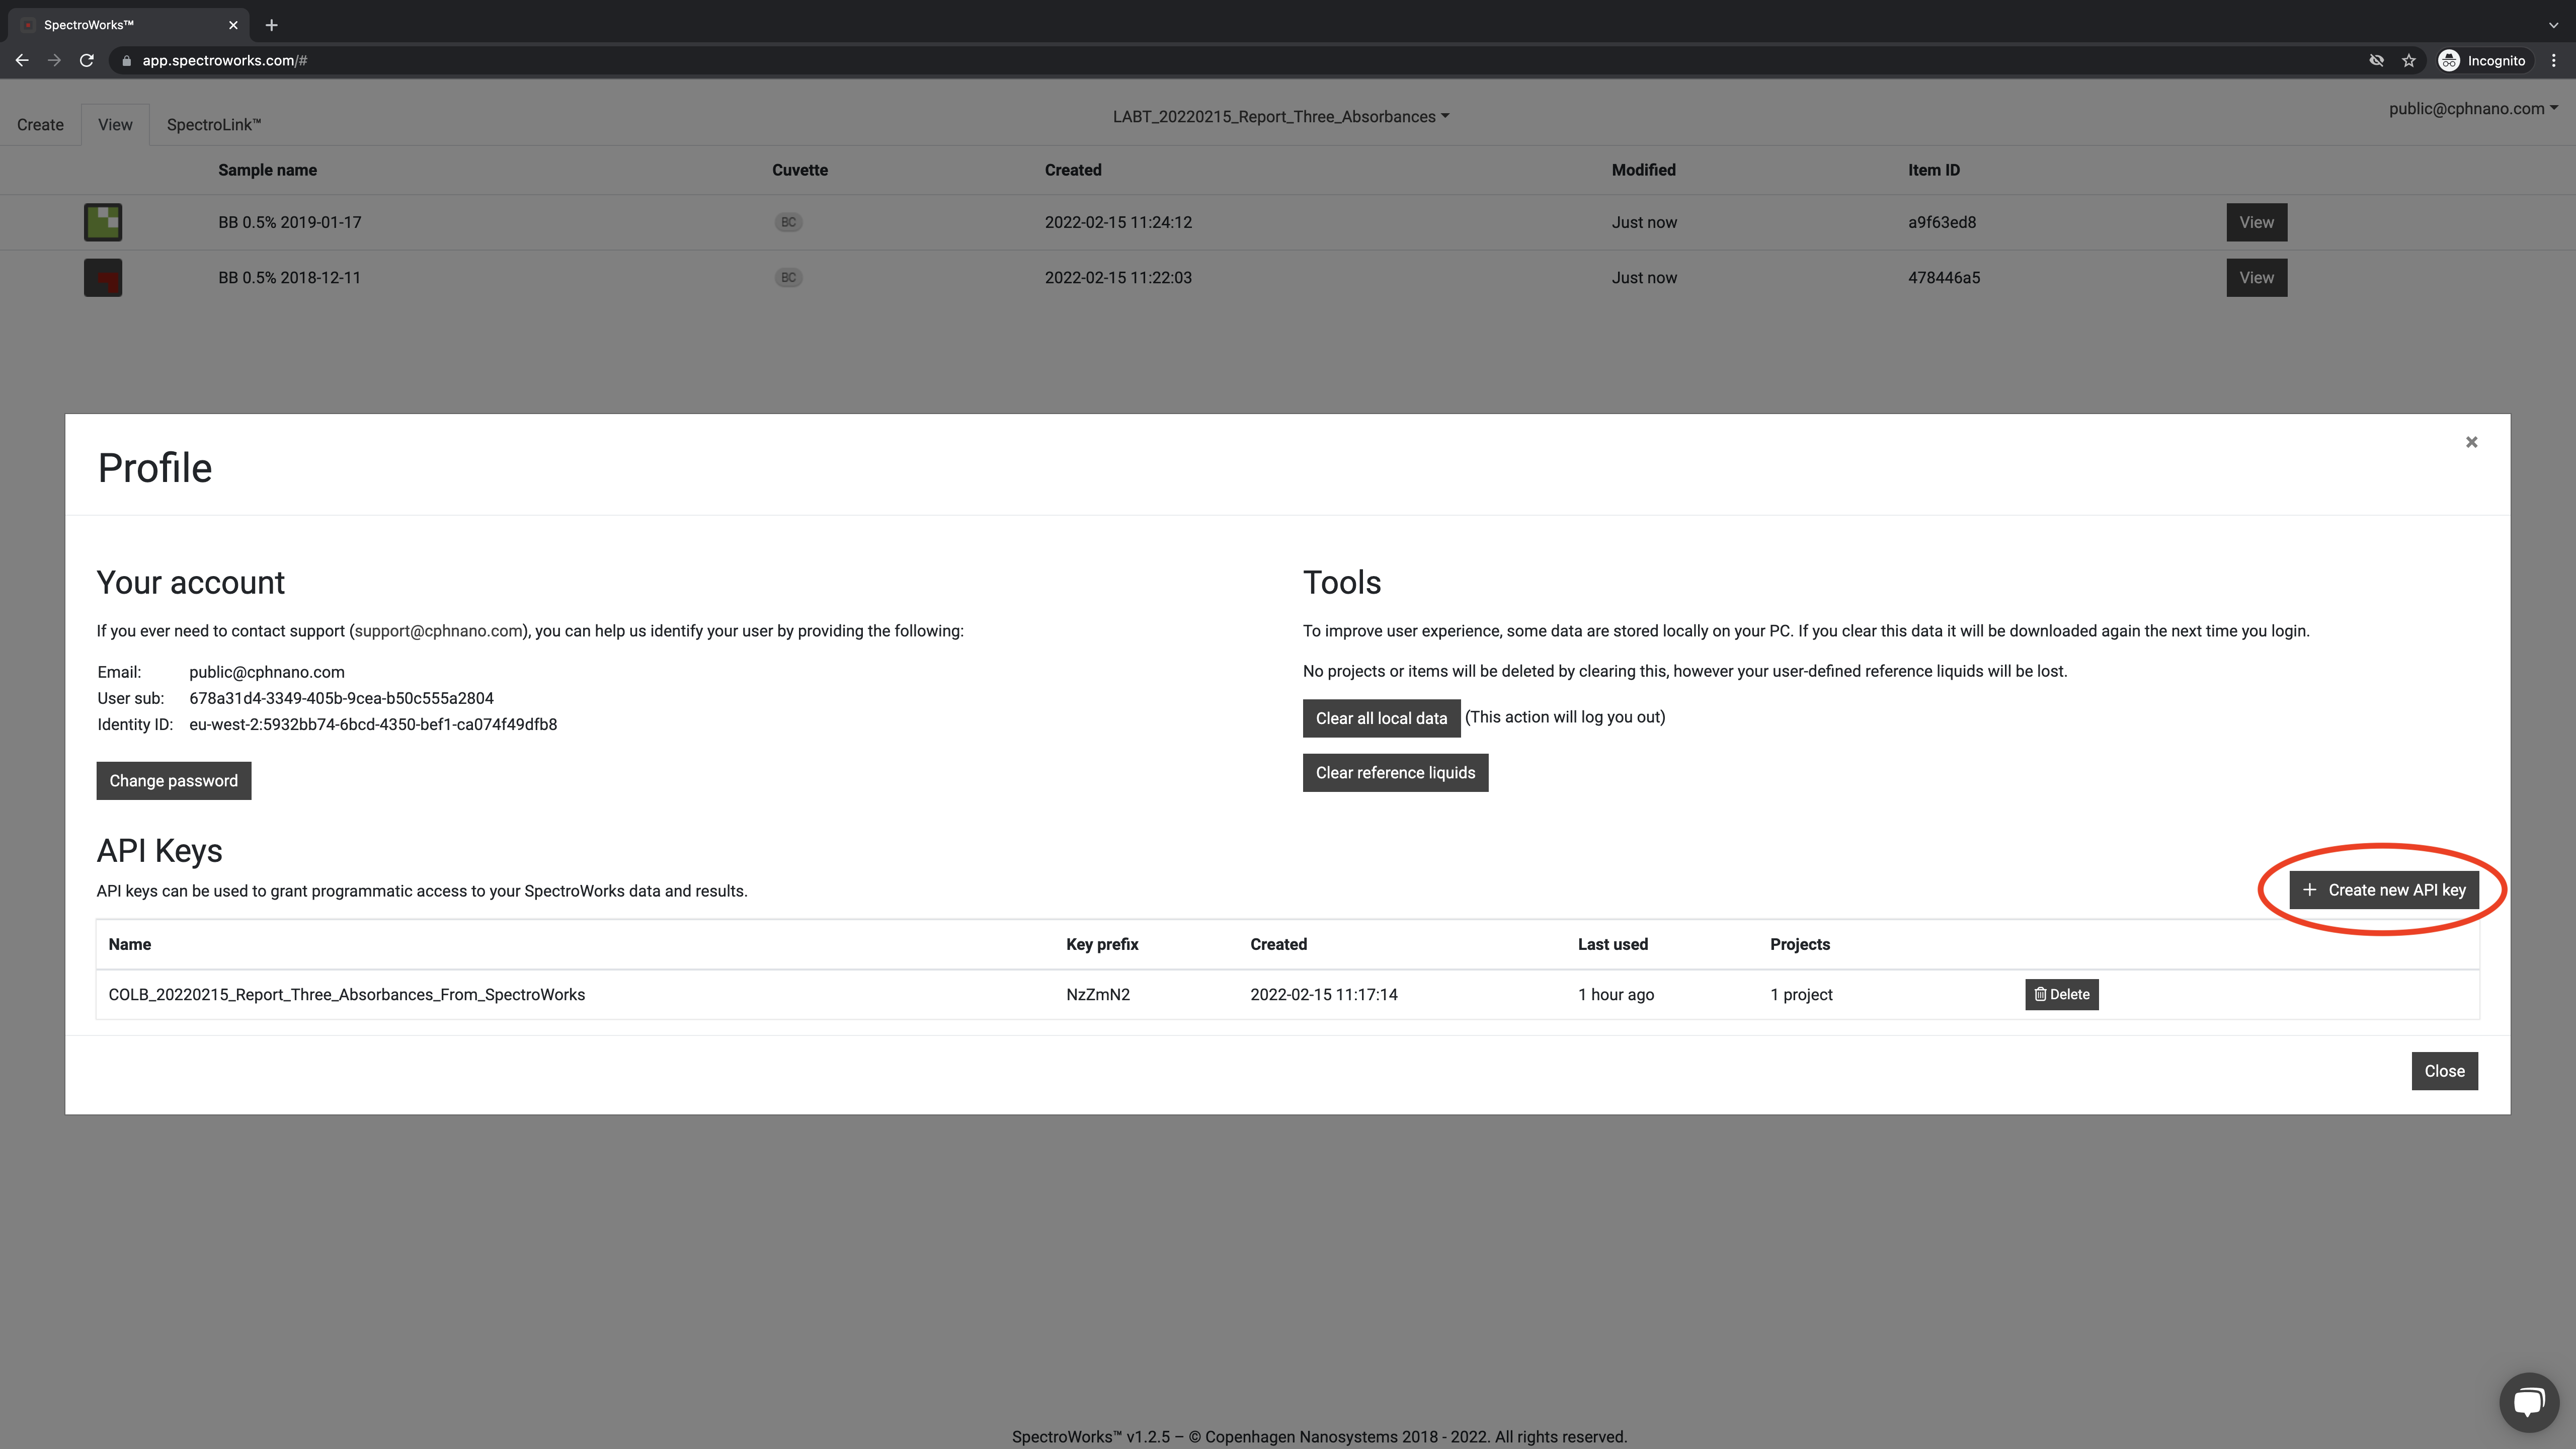
After having uploaded as many spectra as you like, click on Profile under your e-mail.
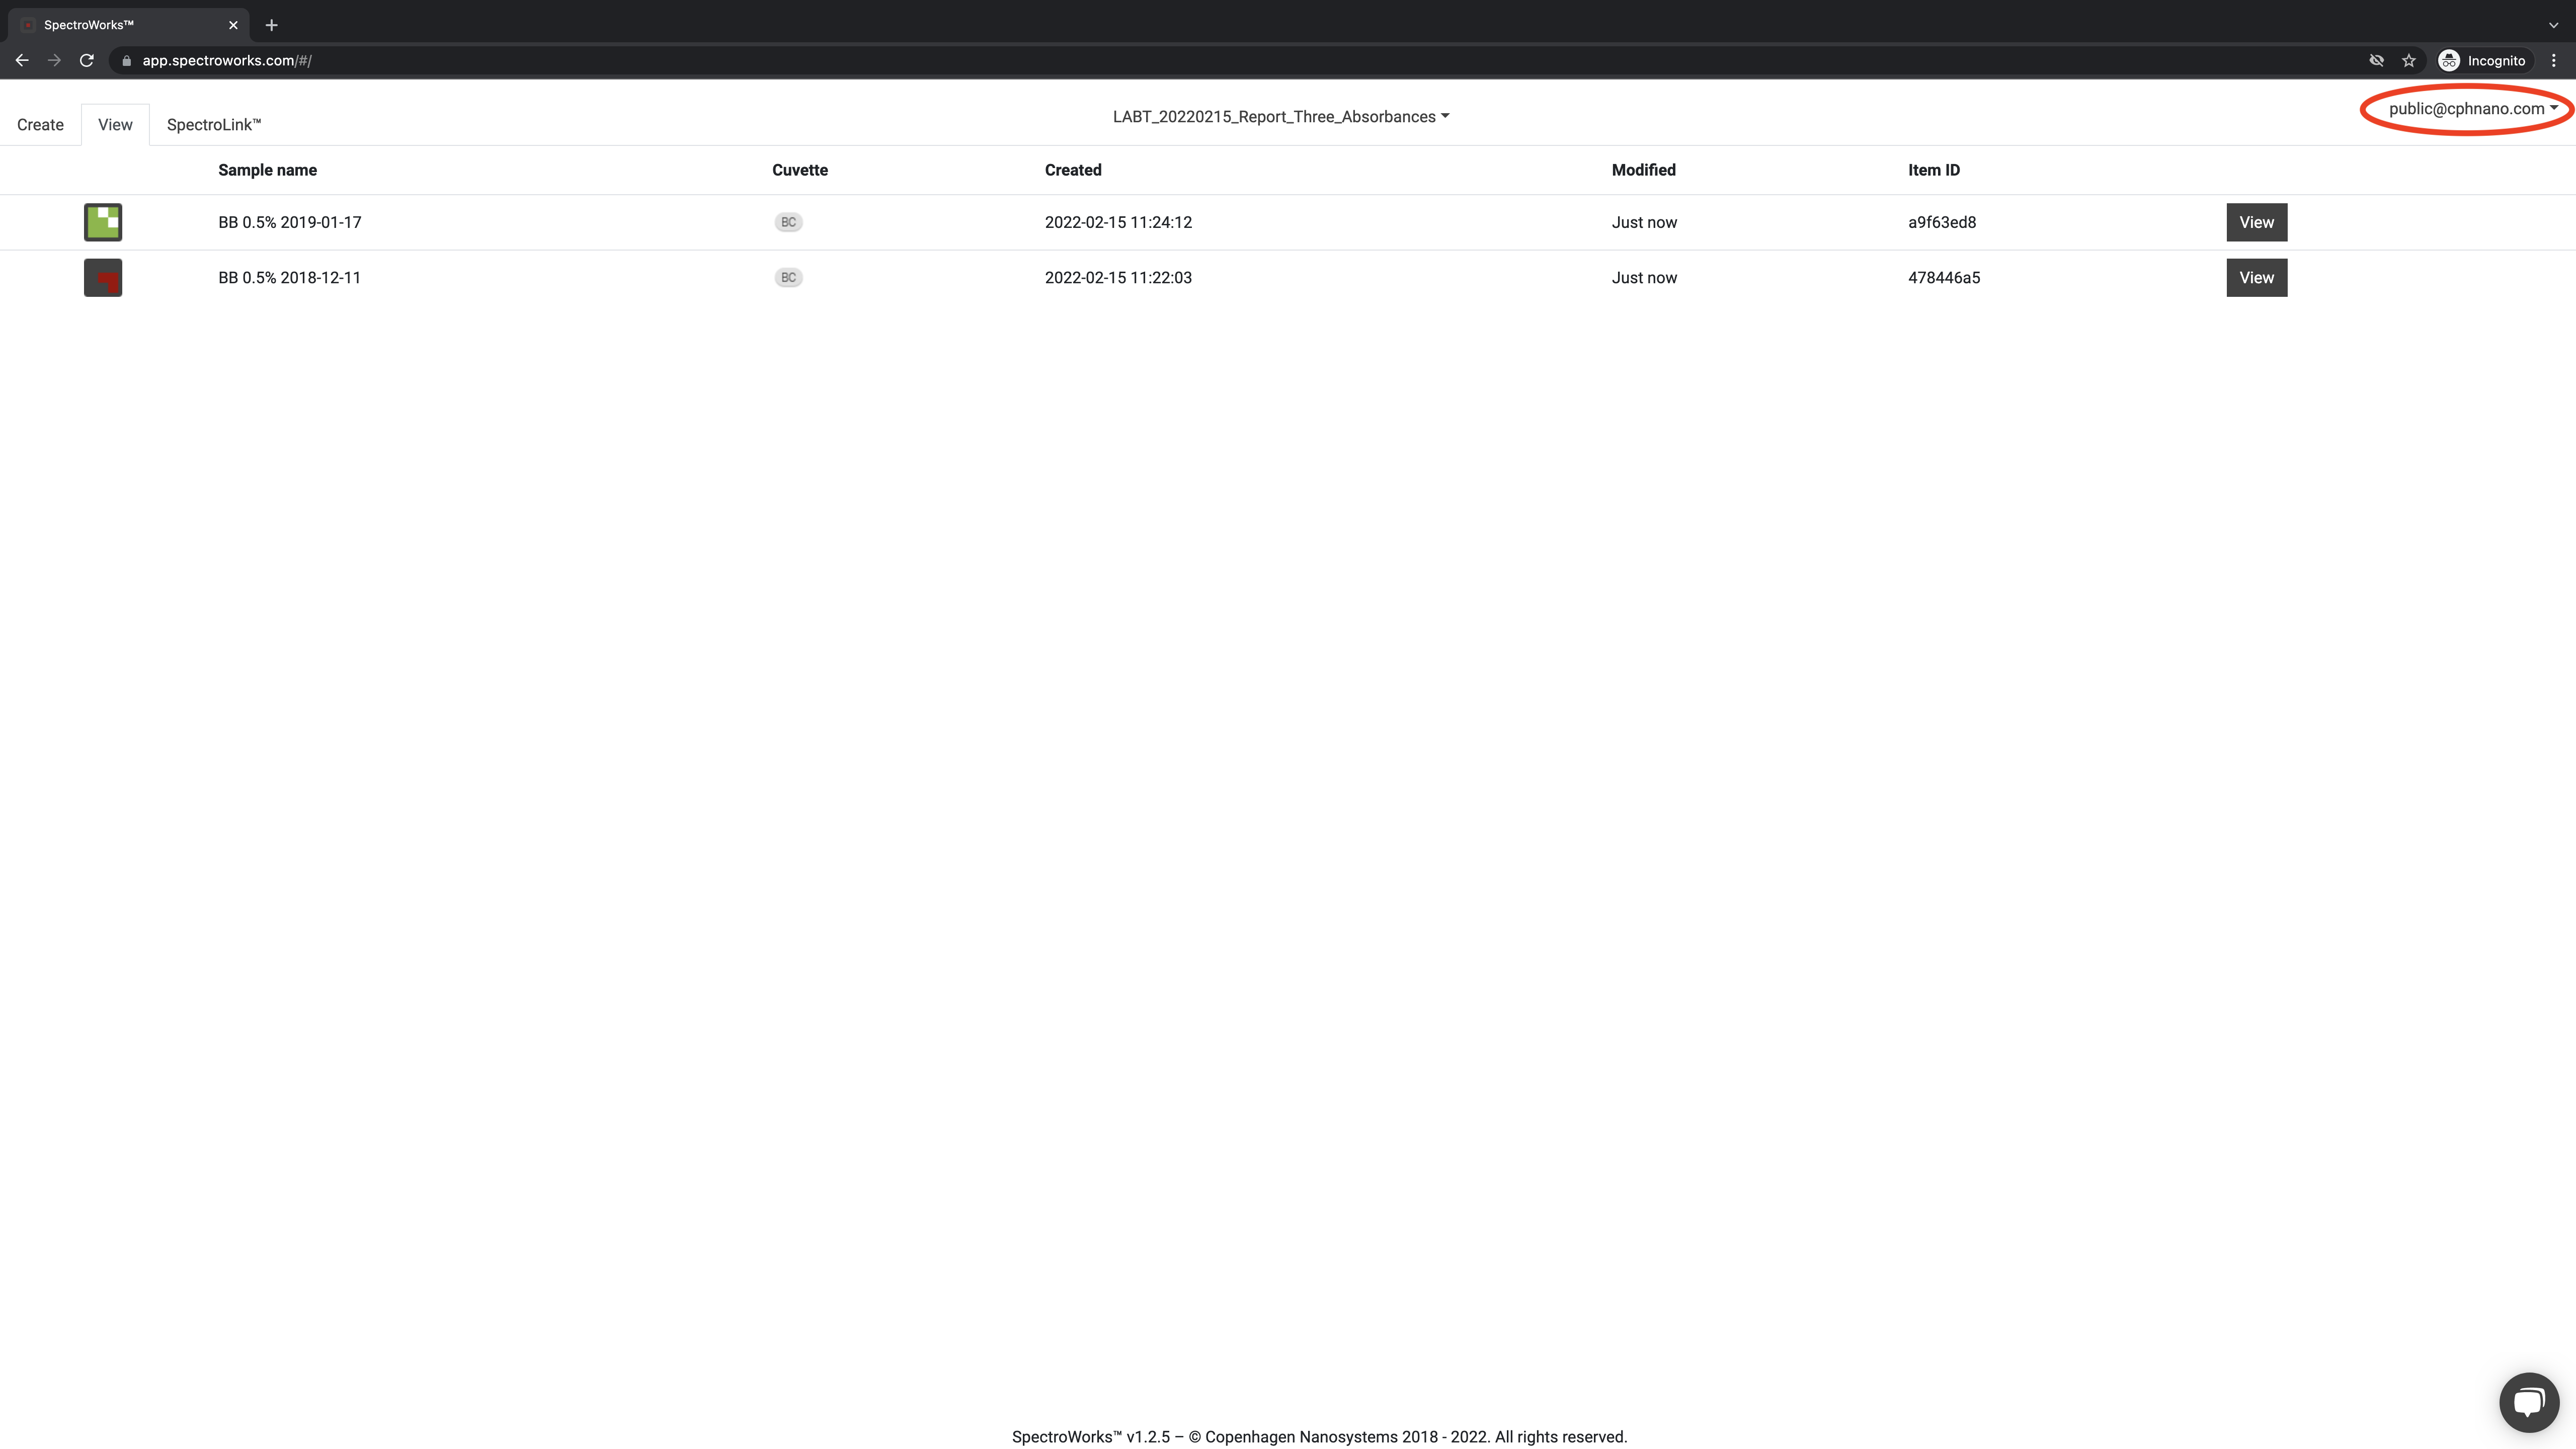
Select Create new API key.
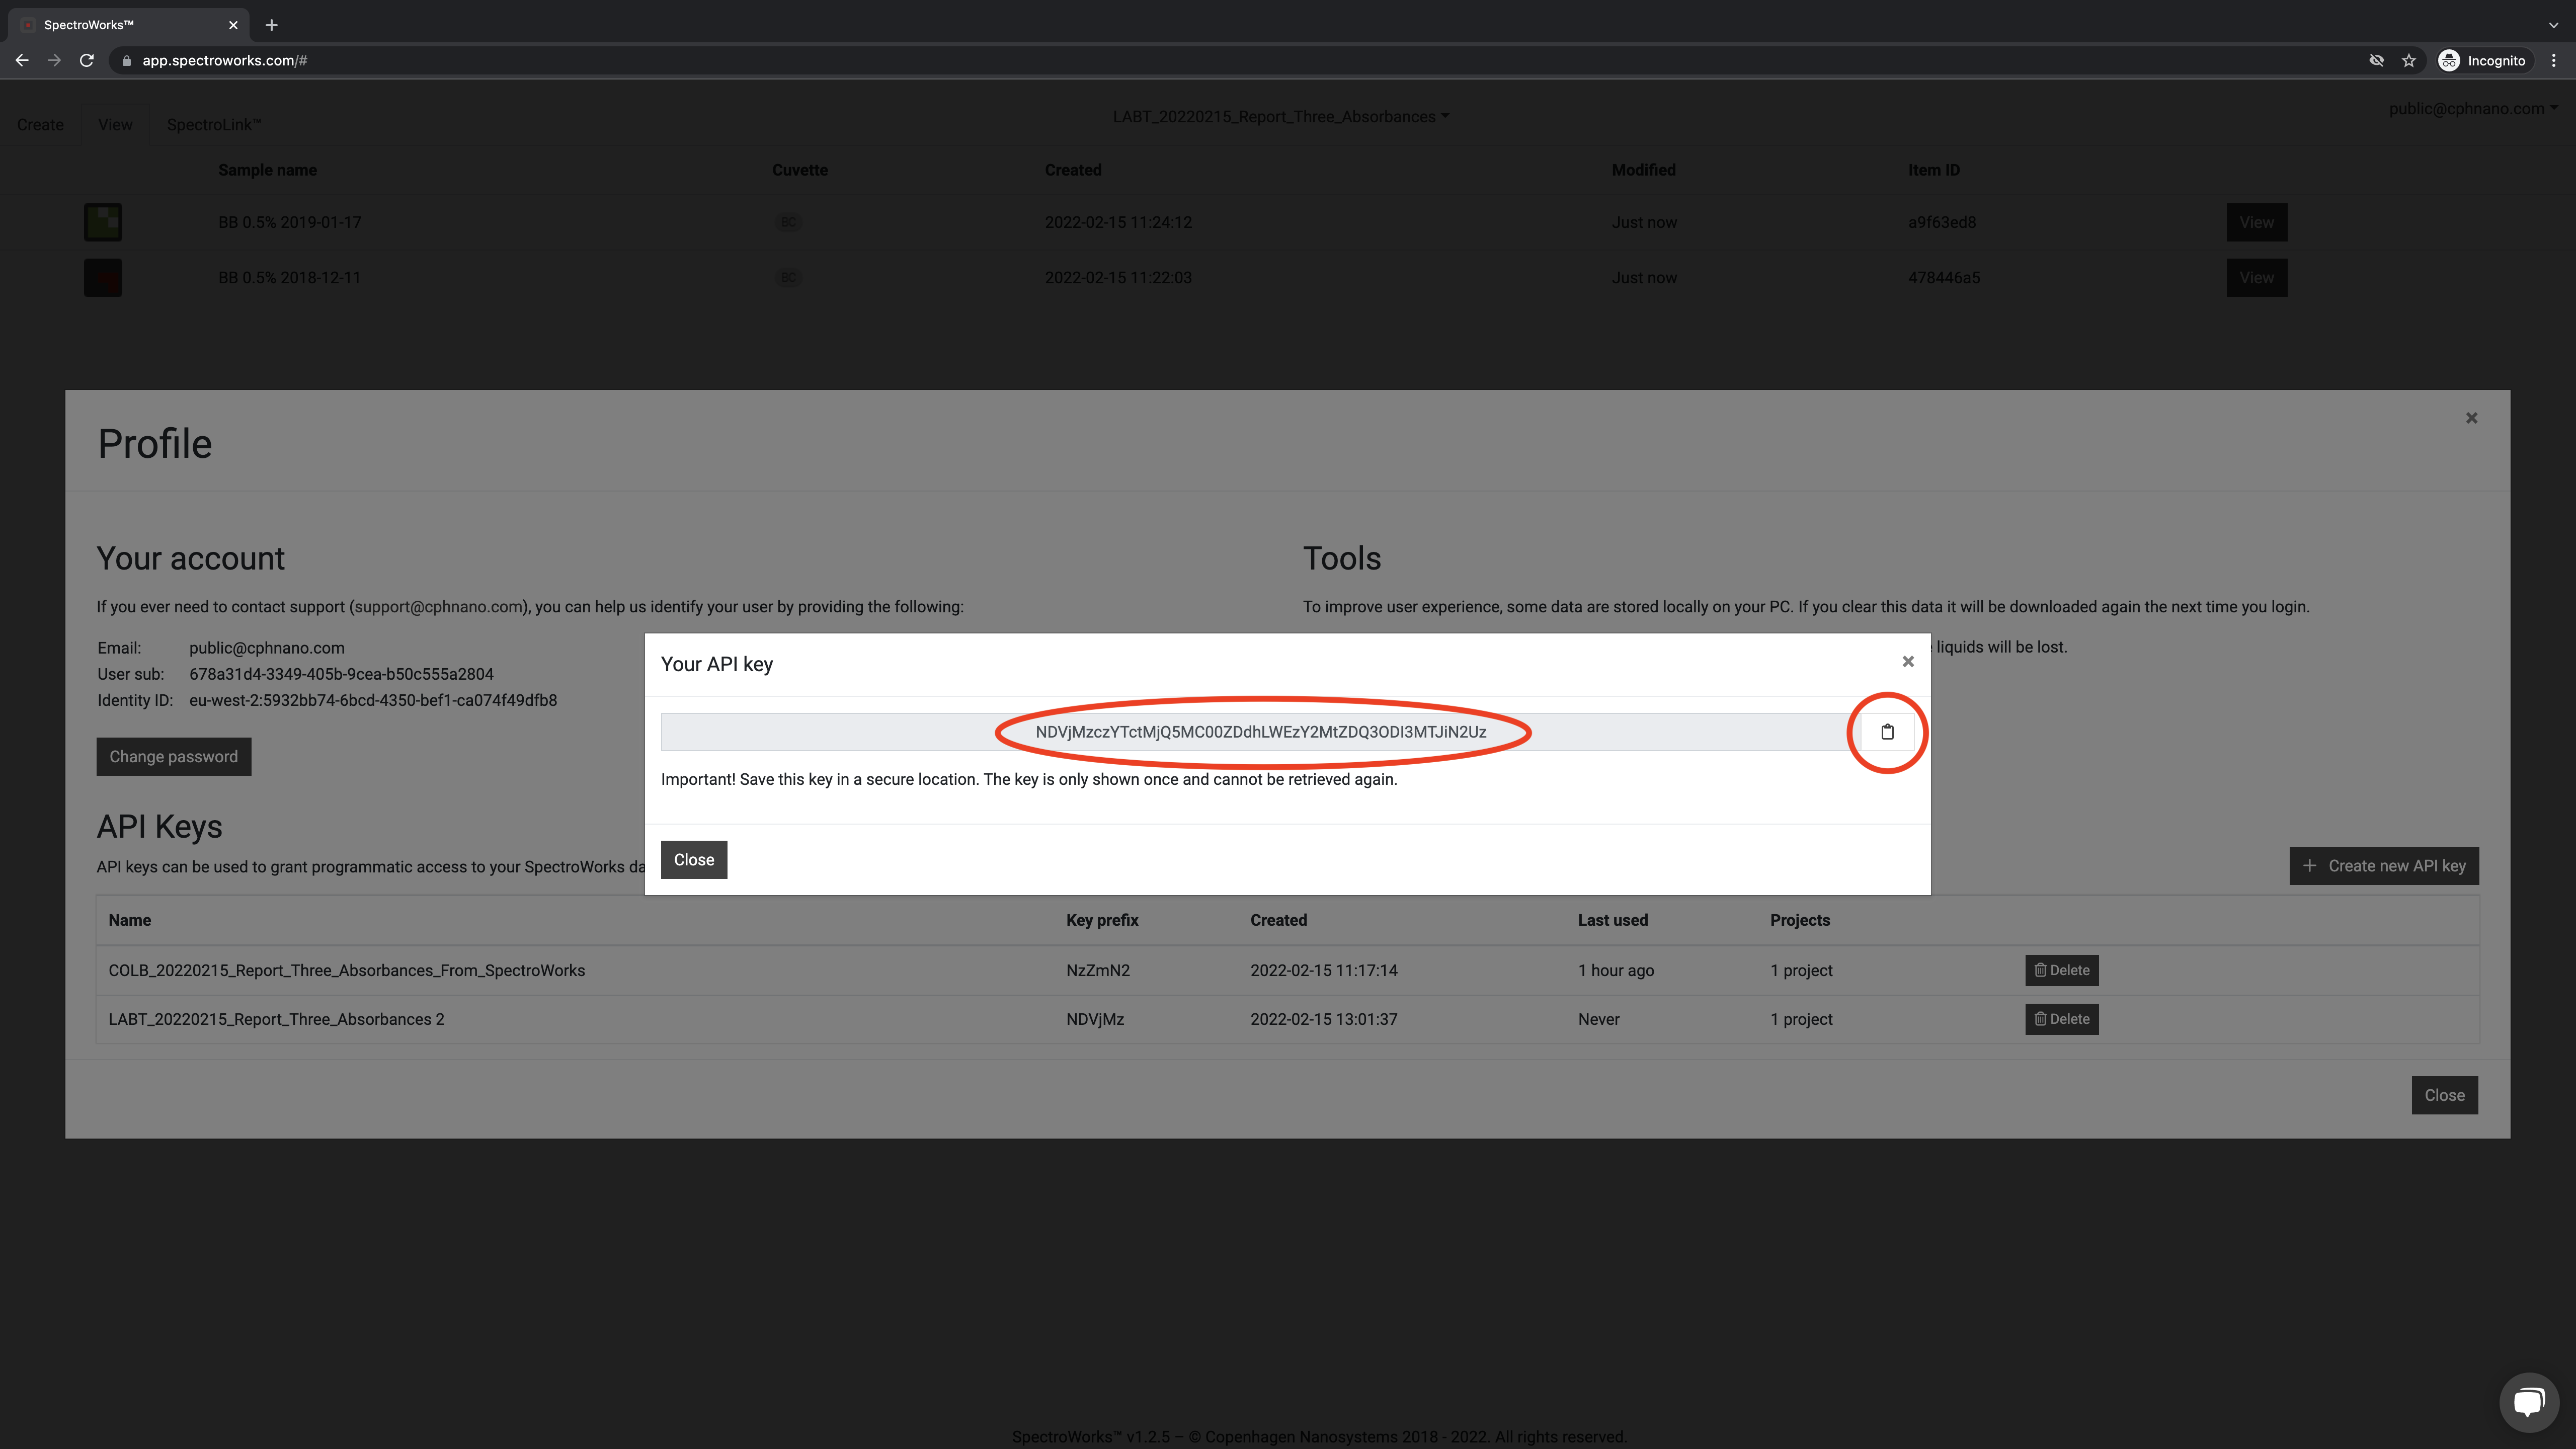
Copy the API key to a secure place.
Absorbance sum in Colab notebook
Unfortunately, SpectroWorks™ does not support calculating the sum of three absorbance values. However, instead we can import the data from SpectroWorks™ on the fly and use a Colab notebook for the calculation. The report "Quality control report template for extracting and adding three absorbance values via SpectroWorks™" can be found here:
https://colab.research.google.com/drive/17BqWYozBCVQmz-yDB2QgSB3g3u0fLcfC?usp=sharing
The Colab notebook contains all the code to extract data from SpectroWorks™ automatically and calculate the sum of absorbance values.
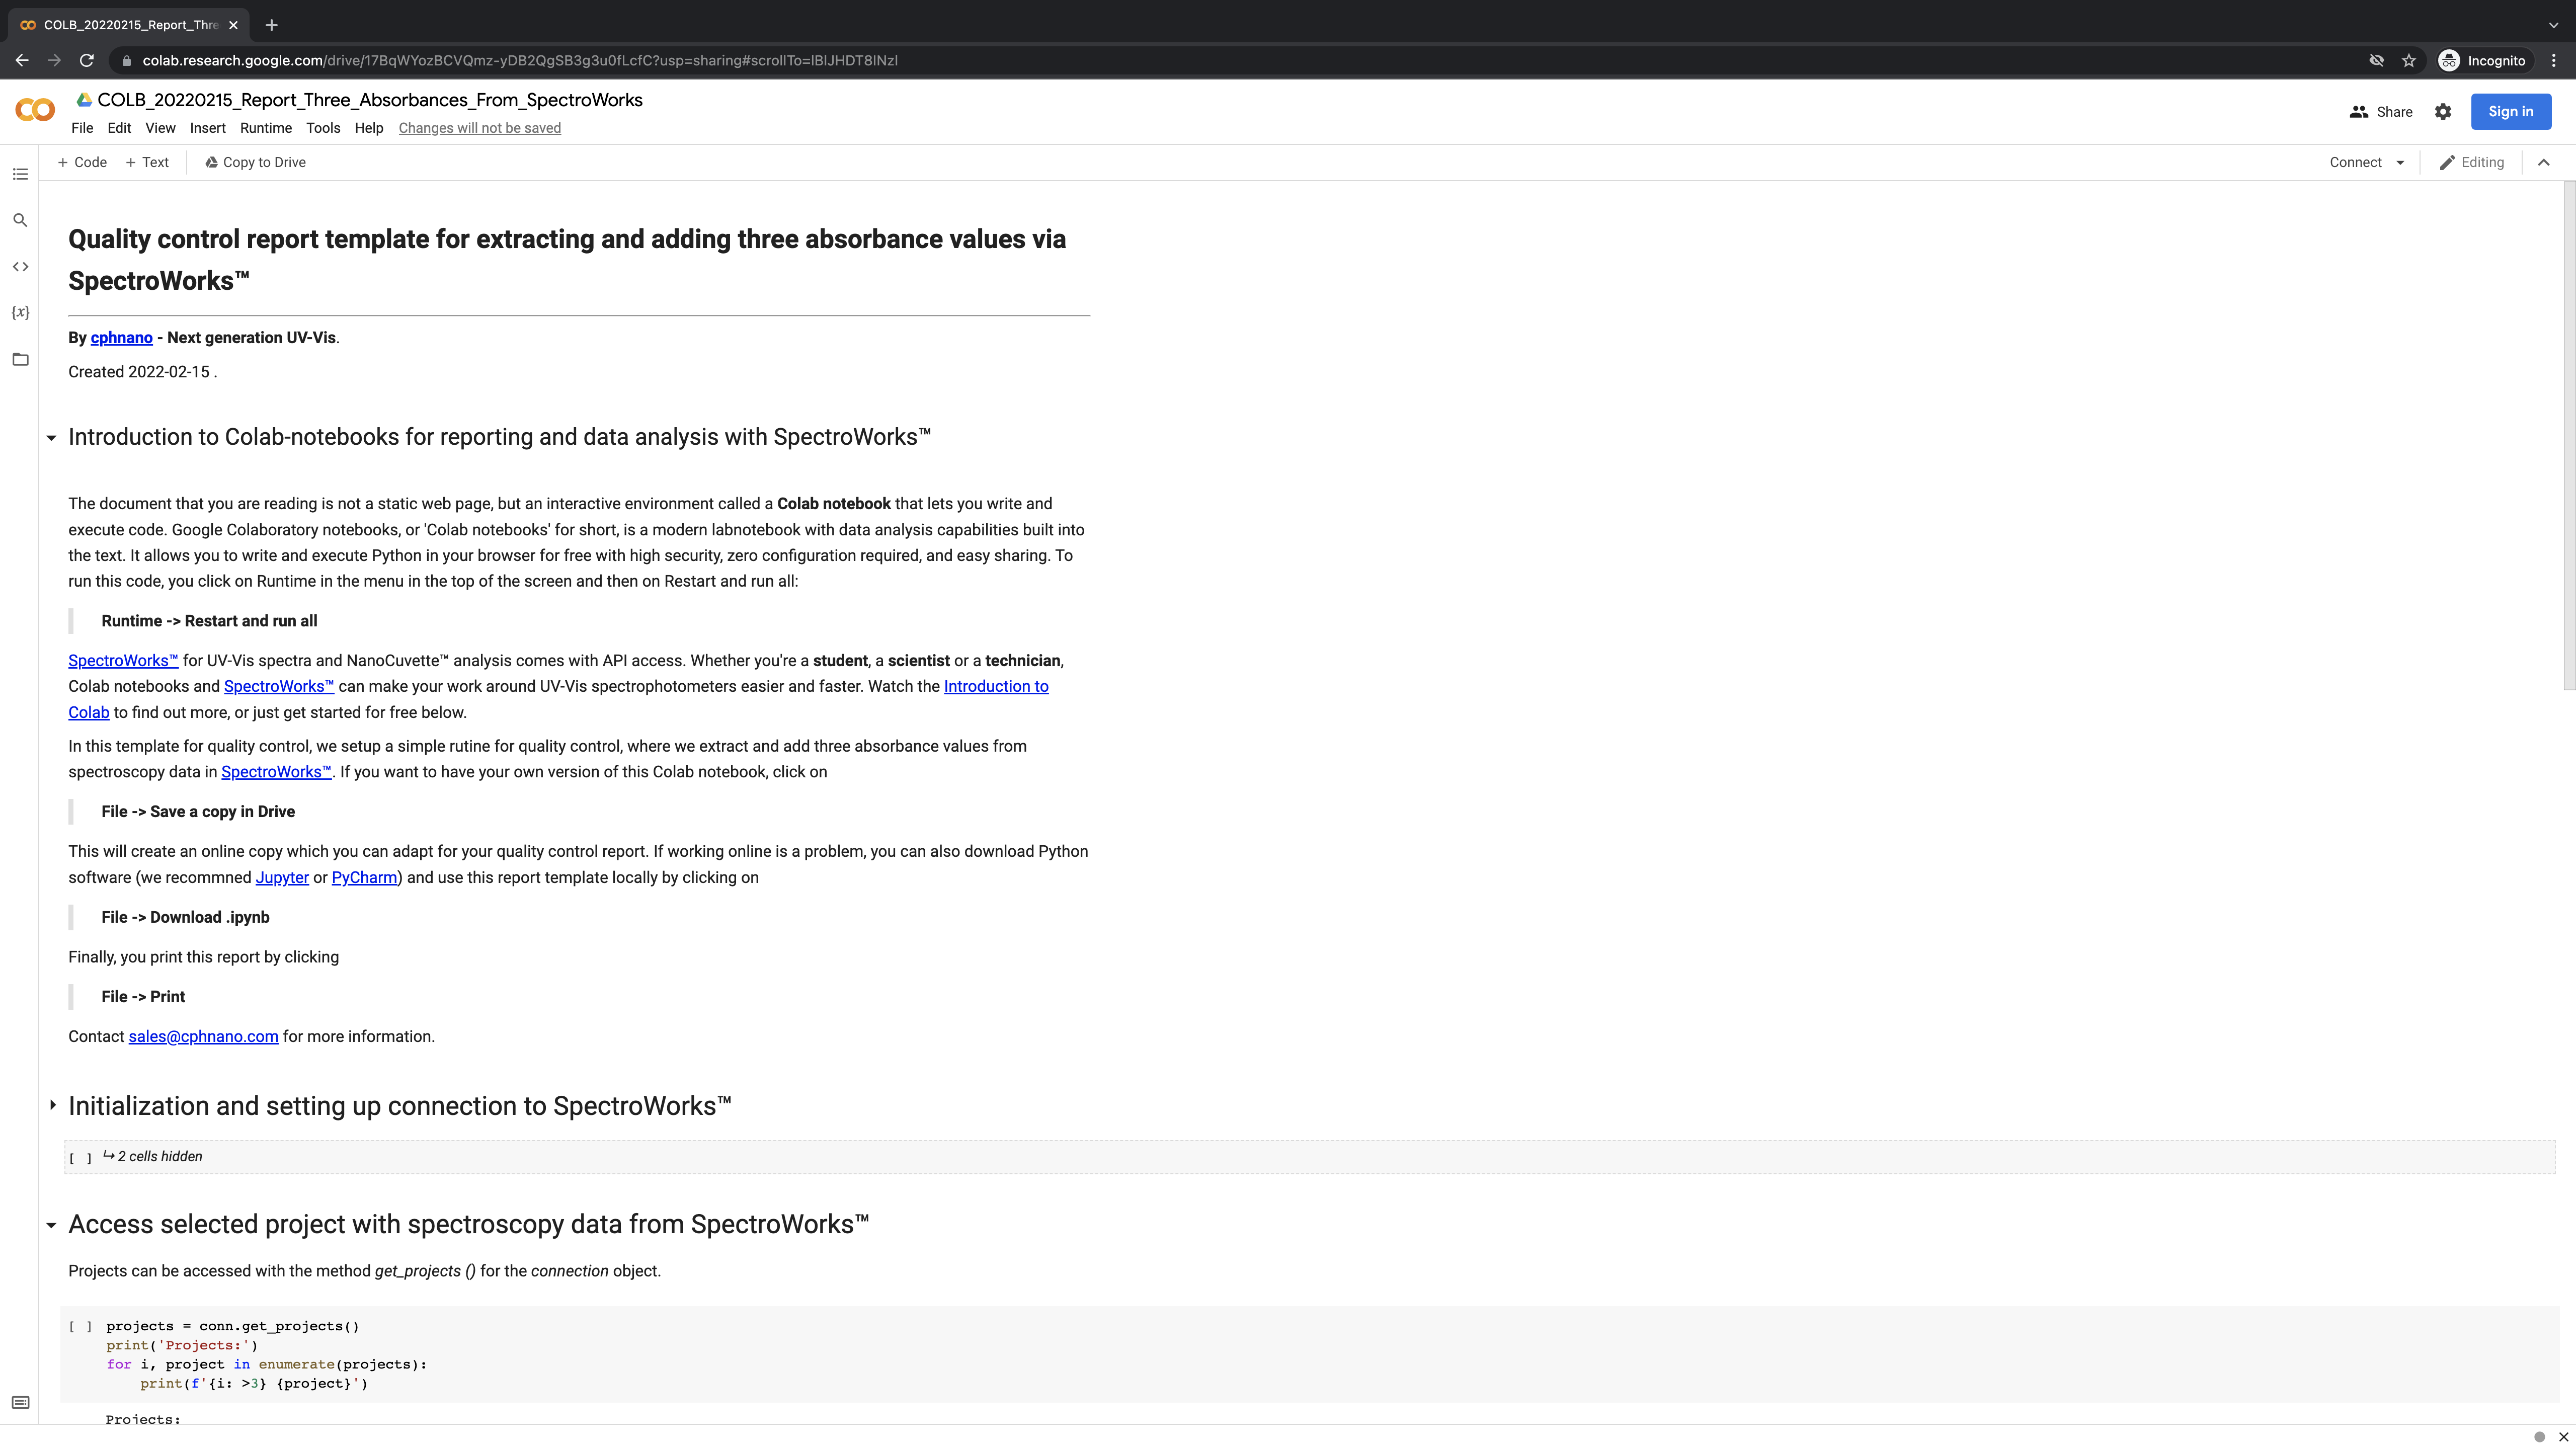
Running the Colab notebook, it is now possible to calculate the sum and plot the different measurements to see if the chosen metric is stable from sample to sample and over time.
If extra samples are added over time and the user click Run, the graphs automatically are updated in seconds with the latest data and the report can be printed and used for documentation.
Conclusion
Here we described a quality control report template demo for extracting and adding three absorbance values for example 420 nm, 520 nm and 620 nm via SpectroWorks™ and a Colab notebook. It also plots the results of the different samples over time to see if the readings stay on spec.
SpectroWorks™ for UV-Vis spectra and SpectroCuvette™ analysis comes with API access. Whether you’re a student, a scientist or a technician, Colab notebooks and SpectroWorks™ can make your work around UV-Vis spectrophotometers easier and faster.