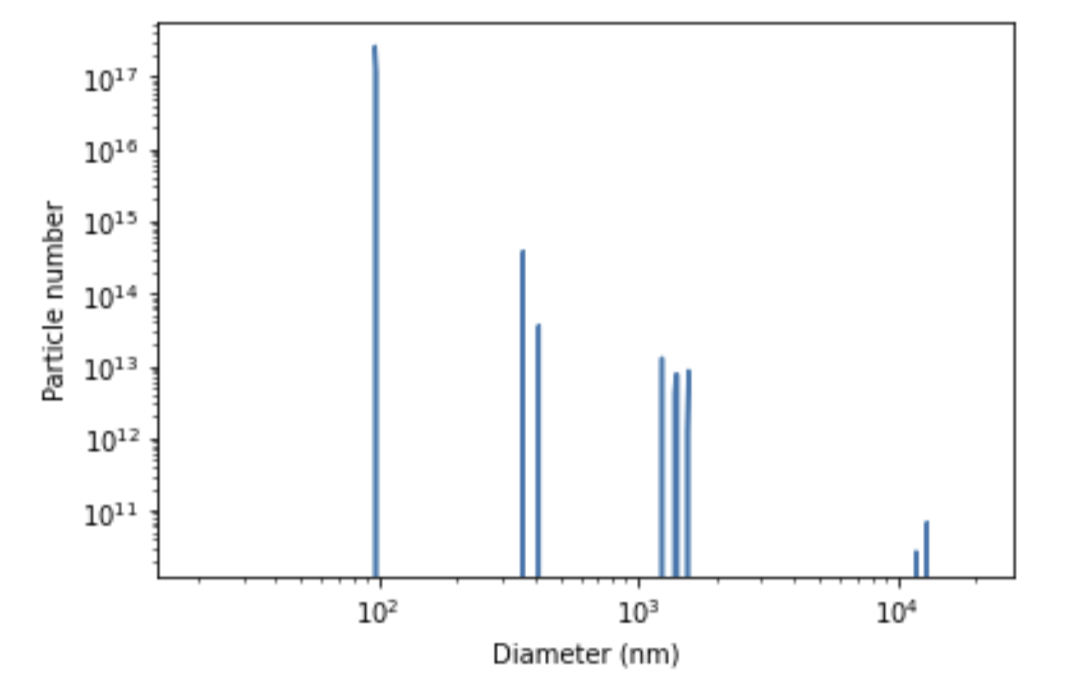
Fig. 1 Example plot showing number of particles of TiO₂ and their diameters.
For further information about this application of the particle size distribution, you can look at our Custom UV-Vis Solution for titanium dioxide applications.

Frequently Asked Questions (FAQ)
The SpectroCuvette™ S and SpectroWorks™ can determine different particle sizes and their relative concentrations.
Fig. 1 Example plot showing number of particles of TiO₂ and their diameters.
For further information about this application of the particle size distribution, you can look at our Custom UV-Vis Solution for titanium dioxide applications.